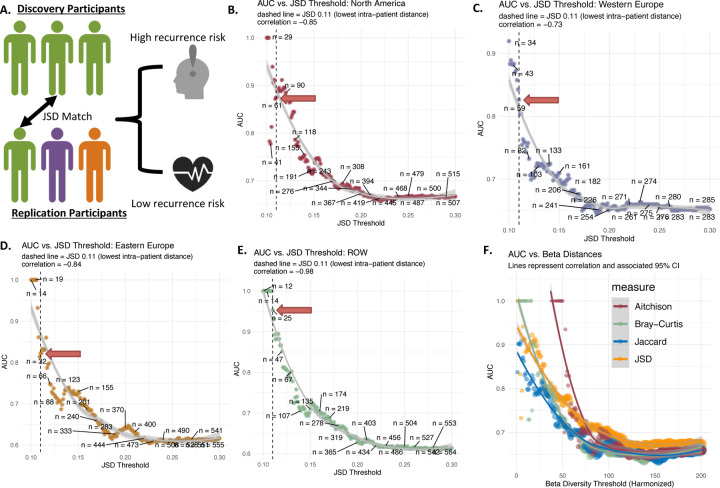
Figure 4. Recurrence Risk Prediction Models in Patients Using Independent Cross-regional Replicates Matched on GMB.
Panel A depicts the patient matching method employed to generalize markers (i.e. using the region specific markers in other geographic areas for patients with the “same” GMB). JSD was used to match patients across region (testing patients are always from a different region from training patients), and subsequently, the predictive power of biomarkers was evaluated in the subsequent panels with adjustment for age, sex, tumor stage, BRAF mutation and study arm. Panel B shows the relationship between prediction measured using AUC vs. increasing JSD distance (spearman correlation = −0.85, p<0.001). For each point (200 total) a non-North American patient is matched to a North American subject at each JSD threshold and the final independently matched set is modeled using the North America markers to obtain AUC. Panel C, D and E show the same analysis, but using the ROW, Eastern Europe and Western Europe as discovery sets respectively. Panel F shows the comparison between the original JSD beta-diversity as well as Bray-Curtis dissimilarity, Jaccard index, and Aitchison dissimilarity with respect to AUC predictive power. Metrics were standardized by setting the lower limit to the median intra-sample distance and the upper limit to the median inter-sample distance, with 200 equal intervals for testing.

