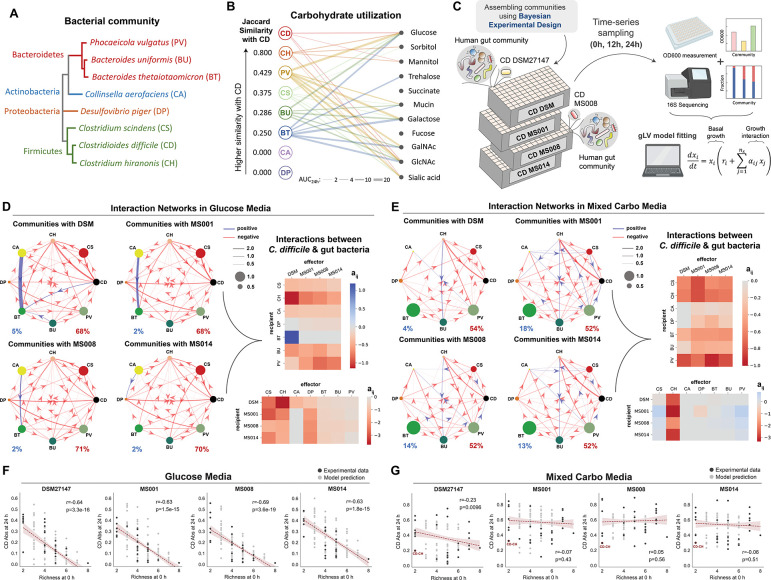
Figure 2. Interspecies interactions between C. difficile strains and the human gut bacteria in different nutrient environments.
a, Phylogenetic tree of the 7-member resident synthetic gut community and C. difficile. The phylogenetic tree was generated from the 16S rRNA sequence of each species using the Clustal Omega multiple sequence alignment tool. b, Bipartite network of carbohydrate utilization by C. difficile and gut bacteria based on their monoculture growth profiles in Fig. S1a–b. The edge thickness indicates the AUC24h of the gut species grown in specific carbohydrates subtracted by the AUC24h of the gut species grown in media without any carbohydrates. Only edges with a magnitude larger than 2 are shown. For C. difficile, the growth profile of the DSM27147 strain is used as a representative. The Jaccard Similarity values of each gut species with C. difficile were computed based on the number of carbohydrates being utilized, where higher Jaccard Similarity values mean larger niche overlap with C. difficile. Different colors represent different species. c, Schematic of the experimental workflow to assess interactions between different C. difficile strains and human gut bacteria in the glucose media. Experimental communities were assembled using the Bayesian experimental design by utilizing monoculture growth data as prior information (See Methods). A total of 147 subcommunities (2 to 8 species) containing combinations of gut species and one of the C. difficile strains were cultured at an equal absolute abundance ratio in the glucose media. Cultures were grown in microtiter plates in anaerobic conditions and incubated at 37°C. After 12 h and 24 h of growth, aliquots of the culture were taken for multiplexed 16S rRNA sequencing to determine community composition and cell density measurement at 600 nm (OD600) to calculate the absolute abundance of each species. Absolute abundance data are used to infer the parameters of a generalized Lotka–Volterra (gLV) model and elucidate the interaction networks of the communities. d-e, Inferred interspecies interaction networks between the 7 gut species and each of the representative C. difficile strains when grown in the glucose media (d) or the mixed carbohydrates media (e). Node size represents species carrying capacity in monoculture (mean of all biological replicates) and edge width represents the magnitude of the interspecies interaction coefficient (aij). Edges represent parameters whose absolute values were significantly constrained to be non-zero based on the Wald test (Fig. S8 for glucose media and Fig. S10 for mixed carbohydrates media). Percentage of positive (blue) and negative (red) interactions for each community are shown. The right panel shows the heatmap of interspecies interaction coefficients of the gLV model between the different C. difficile strains and the 7 gut species in the glucose media (d) or the mixed carbohydrates media (e). f-g, Scatter plots of C. difficile absolute abundance at 24 h as a function of initial species richness in all possible subcommunities of 2–8 species simulated by the gLV (gray data points) and in experimentally measured subcommunities (mean value of biological replicates, black data points). Panel f are model predictions and experimental data of communities grown in the glucose media, whereas Panel g are those grown in the mixed carbohydrates media. Red dashed line indicates the linear regression between the species richness at 0 h and C. difficile absolute abundance at 24 h, with the 95% confidence bounds shown as red shading. Pearson’s correlation coefficient (r) and p-values are shown, which were computed using the pearsonr from the scipy package in Python. Parts of the figure are generated using Biorender.

