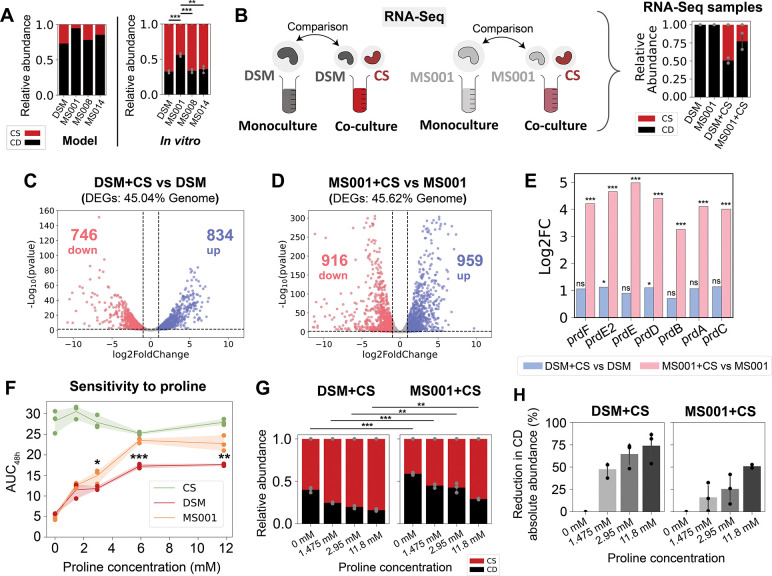
Figure 3. Genome-wide transcriptional profiling of C. difficile DSM27147 and C. difficile MS001 in the presence of C. scindens.
a, Model prediction and independent experimental validation (not included in model fitting) of the relative abundance of pairwise communities containing CS and one of the four C. difficile strains. Each bar represents the average absolute abundance of each species, and the error bars on the in vitro data represent s.d. (n=3). Asterisks above the bars indicate the p-value from unpaired t-test of species relative abundance between co-cultures: ** indicates p<0.01, *** indicates p<0.001. b, Schematic of the genome-wide transcriptional profiling experiment of two C. difficile strains in the presence of C. scindens. Monocultures of C. difficile DSM and MS001 strain, and cocultures of DSM+CS and MS001+CS were grown in the mixed carbohydrates media for ~7 h until they reached exponential phase. Aliquots were taken for DNA extraction for next-generation sequencing to determine the cocultures’ composition, and aliquots were taken for RNA extraction for RNA-Seq. Transcriptomes of C. difficile in cocultures (DSM+CS and MS001+CS) were compared to the C. difficile monocultures’ transcriptome. The panel on the right shows the stacked bar plot of the composition of the samples subjected to RNA-Seq as determined by 16S sequencing. c-d, Volcano plots of log-transformed transcriptional fold changes for C. difficile DSM27147 (c) and MS001 strain (d) in the presence of C. scindens. Vertical dashed lines indicate 2-fold change, and the horizontal dashed line indicates the statistical significance threshold (p = 0.05). Blue indicates up-regulated genes and red indicates down-regulated genes. e, Bar plot of the log-transformed fold changes of the proline reductase (prd) genes of the DSM strain in the presence of CS compared to monoculture (blue) and the MS001 strain in the presence of CS compared to monoculture (pink). Asterisks above the bars indicate the adjusted p-value from DESeq2 differential gene expression analysis: * indicates p<0.05, *** indicates p<0.001, ns indicates not significant (p>0.05). f, Sensitivity of C. difficile DSM27147, MS001, and C. scindens monoculture growth towards proline concentration in the mixed carbohydrates media. AUC48h was calculated from the growth curves in Fig. S17a. Data were shown as mean and 95% c.i. (shading), n = 3 biological replicates. Asterisks indicate the p-value from unpaired t-test of the AUC48h between DSM and MS001 strain at specific proline concentration: * indicates p<0.05, ** indicates p<0.01, *** indicates p<0.001. g, Stacked bar plot of the relative abundance of C. difficile DSM27147 or MS001 grown with CS in media supplemented with different proline concentrations. Each bar represents the average relative abundance of each species, and the error bars represent s.d. (n=3). Asterisks above the bars indicate the p-value from unpaired t-test of the relative abundance between MS001-CS and DSM-CS coculture at a specific proline concentration: ** indicates p<0.01, *** indicates p<0.001. h, Percentage reduction of C. difficile abundance in media supplemented with different concentrations of proline compared to media without proline. Percentage reduction was calculated based on data from Fig. S17d. Error bars represent s.d. (n=3).

