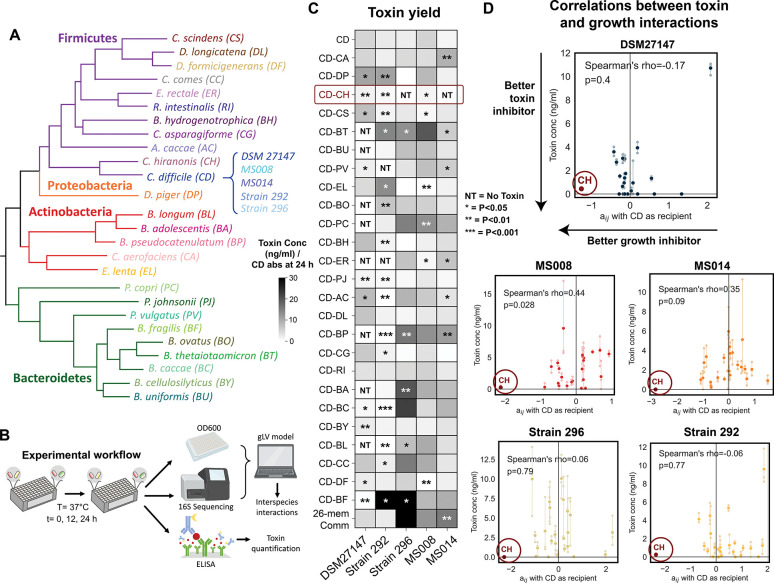
Figure 4. C. hiranonis inhibits the growth and toxin production of diverse C. difficile strains.
a, Phylogenetic tree of 25-member resident synthetic gut community and C. difficile. b, Schematic of the experimental workflow. C. difficile was grown with gut communities and samples were taken at 12 and 24 h. Samples were subjected to OD600 measurement and 16S sequencing to determine species absolute abundance. Time series abundance measurements were fitted to the gLV model to obtain the interaction parameters of the community members. Samples at 24 h were subjected to toxin quantification via ELISA. c, Heatmap of toxin yield (toxin production per C. difficile abundance at 24 h) of different C. difficile strains when grown in pairwise and 26-member communities with human gut bacteria in the mixed carbohydrates media. Toxin concentrations (TcdA and TcdB) were measured in monocultures or communities after 24 h of growth using ELISA (n=3) (Fig. S19a). Asterisks on the heatmap indicate the p-value from unpaired t-test of the toxin yield in cocultures compared to C. difficile monocultures: * indicates p<0.05, ** indicates p<0.01, *** indicates p<0.001, NT indicates No Toxin (toxin concentration per CD absolute abundance = 0 ng/ml). d, Scatter plots of the interspecies interaction coefficients (aij where C. difficile is the recipient) versus toxin production in cocultures. Solid data points indicate the mean of the biological replicates which are represented by transparent data points connected to the mean with transparent lines. The lower the toxin concentration indicates a better toxin inhibitor and the more negative the aij indicates a better C. difficile growth inhibitor. Spearman’s rho and p-value are shown, which were computed using the spearmanr from the scipy package in Python. Parts of the figure are generated using Biorender.

