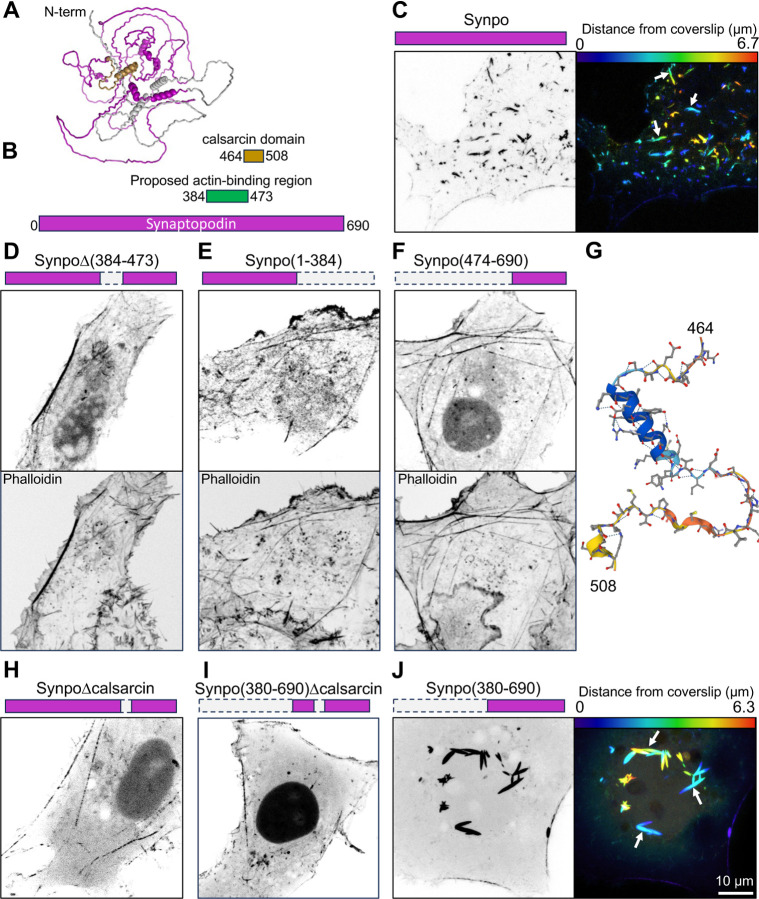
Fig. 3. Synaptopodin regions involved with F-actin and ER binding.
A. Predicted structure of mouse synaptopodin (accession number: Q8CC35–1) based on Alphafold. The synaptopodin construct used for this study is the short splice variant (accession number: Q8CC35–3) that lacks the first 239 residues (shown in gray) and is the brain-specific isoform. The calsarcin domain is shown in gold. B. Domain representation of synaptopodin, showing in green the previously reported actin binding region [42] and its partial overlap with the calsarcin domain (gold). C. COS-7 cell expressing fluorescently tagged full-length synaptopodin and showing the prominent accumulation of synaptopodin inclusions (arrows) that represent actin-ER assemblies. The synaptopodin signal is shown in gray scale (left), and color-coded based on distance from coverslip (right). D–F. COS-7 cells expressing the indicated deletion constructs of synaptopodin (magenta color) lacking the reported actin binding region showing that all of them still partially colocalize with F-actin as indicated by phalloidin staining. G. Predicted structure of the calsarcin region of synaptopodin based on Alphafold. H and I. COS-7 cells expressing synaptopodin deletion constructs showing that the construct including the calsarcin domain (J), but not the ones excluding this domain (H and I) induce the formation of synaptopodin inclusions (arrows) that represent actin-ER assemblies (see Fig. 2).

