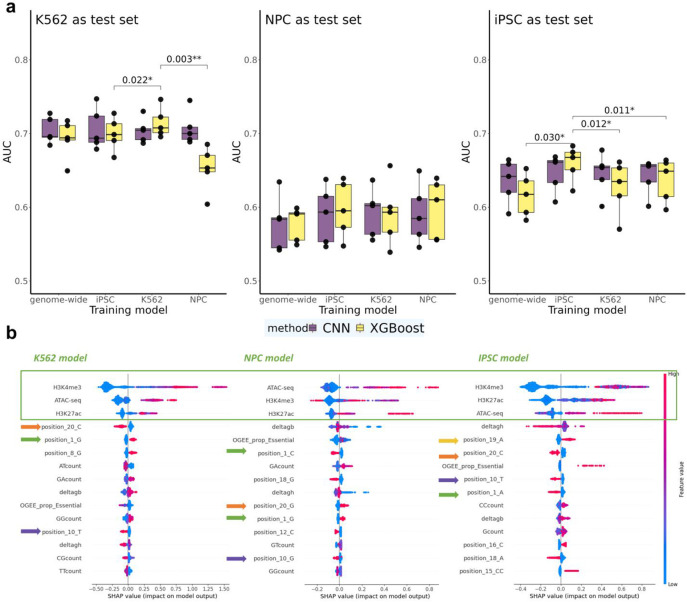
Fig. 5 ∣. Predictive performance for nearby gene expression in the MHC region across different cell types.
a, AUC for CNN and XGBoost models across multiple cell lines in the MHC region. Statistically significant p-values from paired t-tests are listed above the bars. Tests were performed comparing models trained on the same cell line as test set versus models trained on other cell lines. Non-significant comparisons (p>0.05) are omitted. b, SHAP summary plot for XGBoost models, highlighting the top 15 most significant features in each cell line model.

