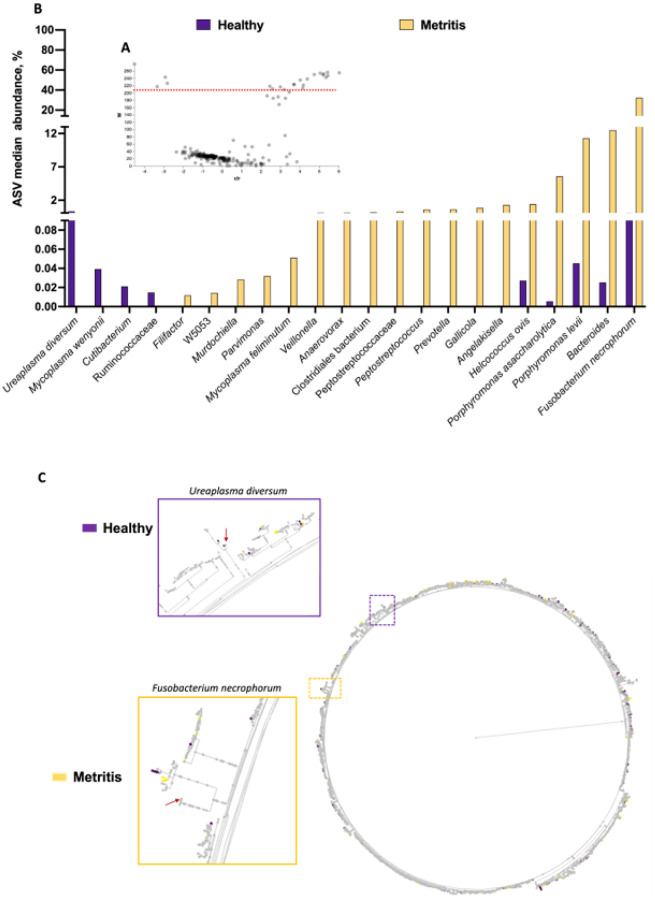
Figure 4.
Differential abundance analysis with ANCOM for microbiomes collected from uterine swabs performed at the time of disease diagnosis. Volcano plot (A) highlighting the 22 differently abundant ASV (18 increased and 4 decreased in metritis compared with healthy cows). The red dotted line represents the cut-off for the W-value (y-axis) indicating statistical significance (features above the dotted line were significantly different between metritis and healthy cows). The W-value represents a count for the number of times that the null hypothesis was rejected for a given ASV. The null hypothesis states that the average abundance of a given ASV is equal in metritis and healthy cows. The x-axis displays the centered log ratio (clr) of the abundance of a given ASV between healthy and metritis cows. A negative clr means an ASV (each gray dot in the volcano plot) is more abundant in healthy than metritis cows, and a positive clr means that the ASV is more abundant in the metritis compared to healthy cows. There were 6 ASV that approached significance tending to increase in metritis compared with healthy cows (Filifactor, Peptococcus simiae, SR1 bacterium, Clostridium cadaveris, Tissierella and Helcococcus). (B) Histogram plotting the median abundance of ASV that were significantly different between healthy and metritis cows based on ANCOM. The displayed abundances (y-axis) were calculated as the median for the percentage of reads mapped to each ASV of interest, out of the total reads sequenced per cow. (C) A phylogenetic tree from EMPress [46] showing the hierarchical evolutionary relationships for the features subjected to ANCOM. The outermost tips of the tree are termed “leaves” and represent a unique ASV. The purple and yellow dotted squares represent areas of the phylogenetic tree that were zoomed in. The red arrows point to the leaves representing the Ureaplasma diversum (purple square) and Fusobacterium necrophorum (yellow square), the most differently abundant ASV that increased in healthy and metritis cows, respectively. Importantly, gray leaves represent ASV that were identified in both healthy and metritis cows, whereas leaves that are purple or yellow represent ASV that were uniquely observed in either healthy or metritis cows, respectively.

