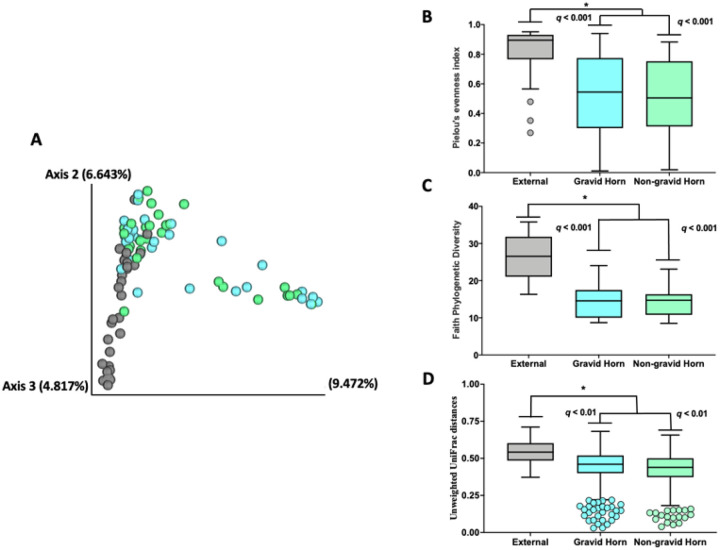
Figure 6.
Jaccard PCoA plot (A), Pielou’s evenness (B), Faith Phylogenetic Diversity (C) and Unweighted Unifrac distances (D) for the microbial composition between samples collect at approximately one month postpartum from the previously gravid (light blue bars and symbols) and non-gravid (light green bars and symbols) uterine horns compared with external control samples collected from the outside of the uterus (gray bars symbols). Individual datapoints plotted beyond the box-and-whiskers plots represent outliers according to the 1.5 interquartile range (IQR) method.

