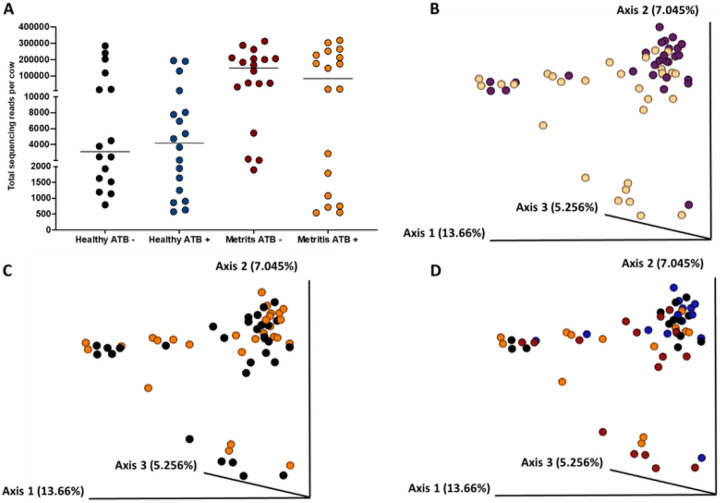
Figure 8.
Uterine microbiome of cows that had been diagnosed at 7 to 10 d postpartum (as metritic or healthy controls) and had their uterine microbiome sampled and analyzed after tissue collection at one month postpartum. Number of 16S rRNA sequencing reads per cow (A), the Jaccard PCoA plot (B) for cows that were either healthy (purple dots) or metritis (yellow dots) at disease diagnosis, the Jaccard PCoA plot (C) for cows that were either antibiotic-treated (orange dots) or untreated (black dots) at disease diagnosis, and the Jaccard PCoA plot (D) for the interaction of disease diagnosis and treatment (Healthy-antibiotic, blue dots; Healthy-not treated, black dots; Metritis-antibiotic treated, orange dots; Metritis-not treated, red dots) are shown.

