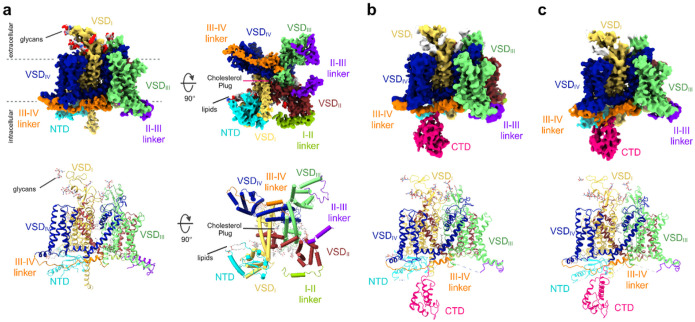
Figure 1. Cryo-EM structures of full-length hNav1.5.
a, Side (left) and intracellular (right) view of the cryo-EM reconstruction of Model-I. Individual domains and inter-domain linkers are segmented and color-coded. The lower panel depicts the atomic structure of Model-I including the resolved inter-domain linkers, lipid molecules, the cholesterol plug, and covalently attached glycans. The structural features are segmented and color-coded according to the density map. b, Side view of the cryo-EM reconstruction of Model-II. Color-coded according to (a). The CTD is segmented and shown in pink. The lower panel shows the atomic structure of Model II. c, Side view of the cryo-EM reconstruction (top) and atomic structure (bottom) of Model-III. Color-coded according to (b).

