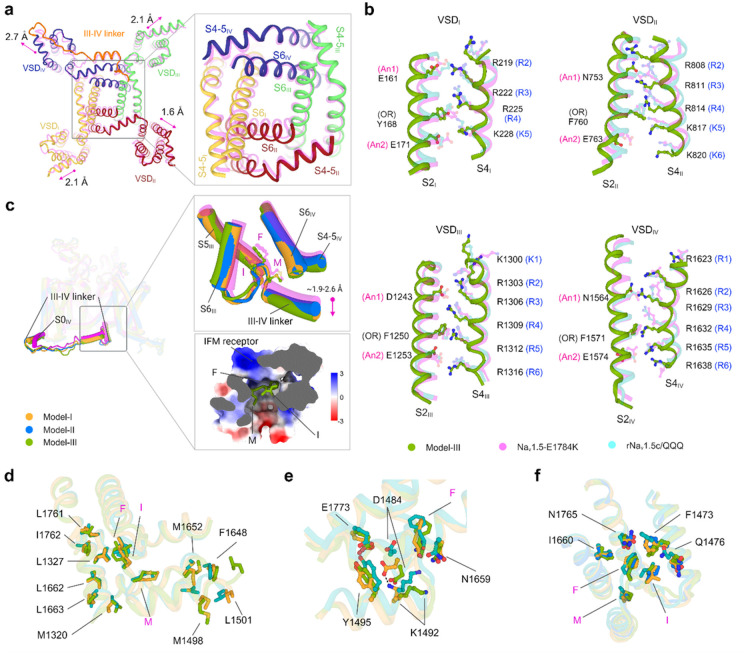
Figure 2. Insights into the pore domains, VSDs, and III-IV linkers of hNav1.5.
a, The intracellular view of the structural superimposition of Model-I (bold color) and Nav1.5-E1784K (PDB ID: 7DTC, transparent magenta) displays a lateral dilation of the VSDs. The inset shows the dilation of the PD. b, Comparative analysis of the conformation of GC residues of individual VSDs in Model-III, Nav1.5-E1784K, and rNav1.5c/QQQ (PDB ID: 7FBS). GC residues are shown in stick representation. An1 and An2 denote anion1 and anion2, respectively. OR is occluding residue. For clarity, only the S2 and S4 segments of all the VSDs are shown. c, Superimposition of Model-I, Model-II, Model-III, and Nav1.5-E1784K (magenta). The III-IV linker and its connecting S0IV helix are highlighted. The conformational changes of the IFM and III-IV linker helix are shown in the upper right inset. The lower inset displays the electrostatic surface potential of the IMF receptor bound to the IFM motif of Model-III. d, Hydrophobic interactions at the IMF receptor of Model-I (bright orange), Model-III (splitpea), and Nav1.5-E1784K (teal). e, Polar interactions at the IMF receptor. D1484 moves downward from NaV1.5-E1784K to Model-III. D1484 and K1492 form a salt bridge in Model-I. f, Interaction between the IFM motif and the receptor pocket residues. Key residues are shown in stick representation.

