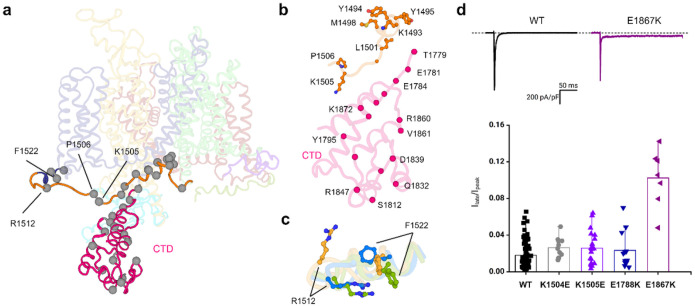
Figure 5. Structural mapping of mutations linked to BrS and LQT3.
a, Structural mapping of mutation hotspot residues (sphere). b, A cluster of selected mutations associated with BrS and LQT3 in the region of III-IV linker and CTD. c, Interaction between R1512 and F1522 in Model-I (bright orange), Model-II (marine), and Model-III (split pea). The π-cation interaction occurs exclusively in Model-III. d,E1867K mutation presented a significant increase in persistent current, but no change in persistent current was observed in K1504E, K1505E, and E1788K.

