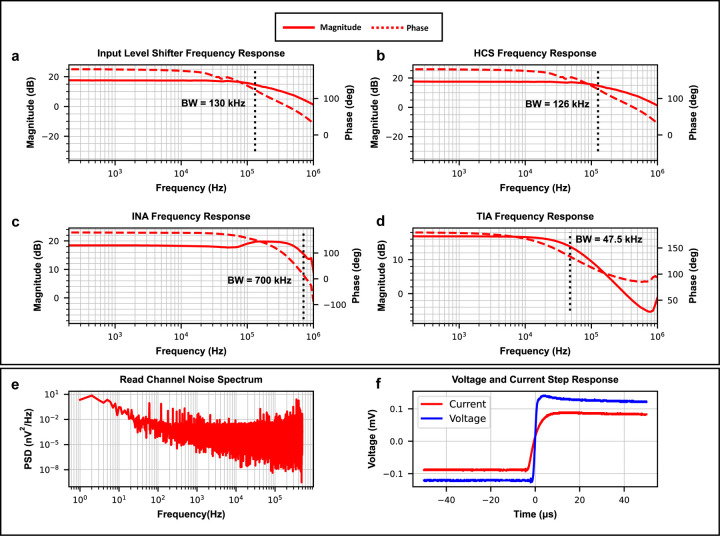
Figure 4: System electrical performance.
The frequency response for each component in the signal path (a-d) was used to find the systems bandwidth. a) Input level shifter frequency response. b) HCS frequency response. c) INA frequency response. d) TIA frequency response. The limiting component is the TIA (d), this component sets the systems bandwidth at 47.5kHz. e) The read channel noise power spectral density (PSD) was found to classify the noise specification of the system. f) The step response of the voltage and current stages in the read channel. The lack of ringing in both step responses confirm the stability of the read channel.

