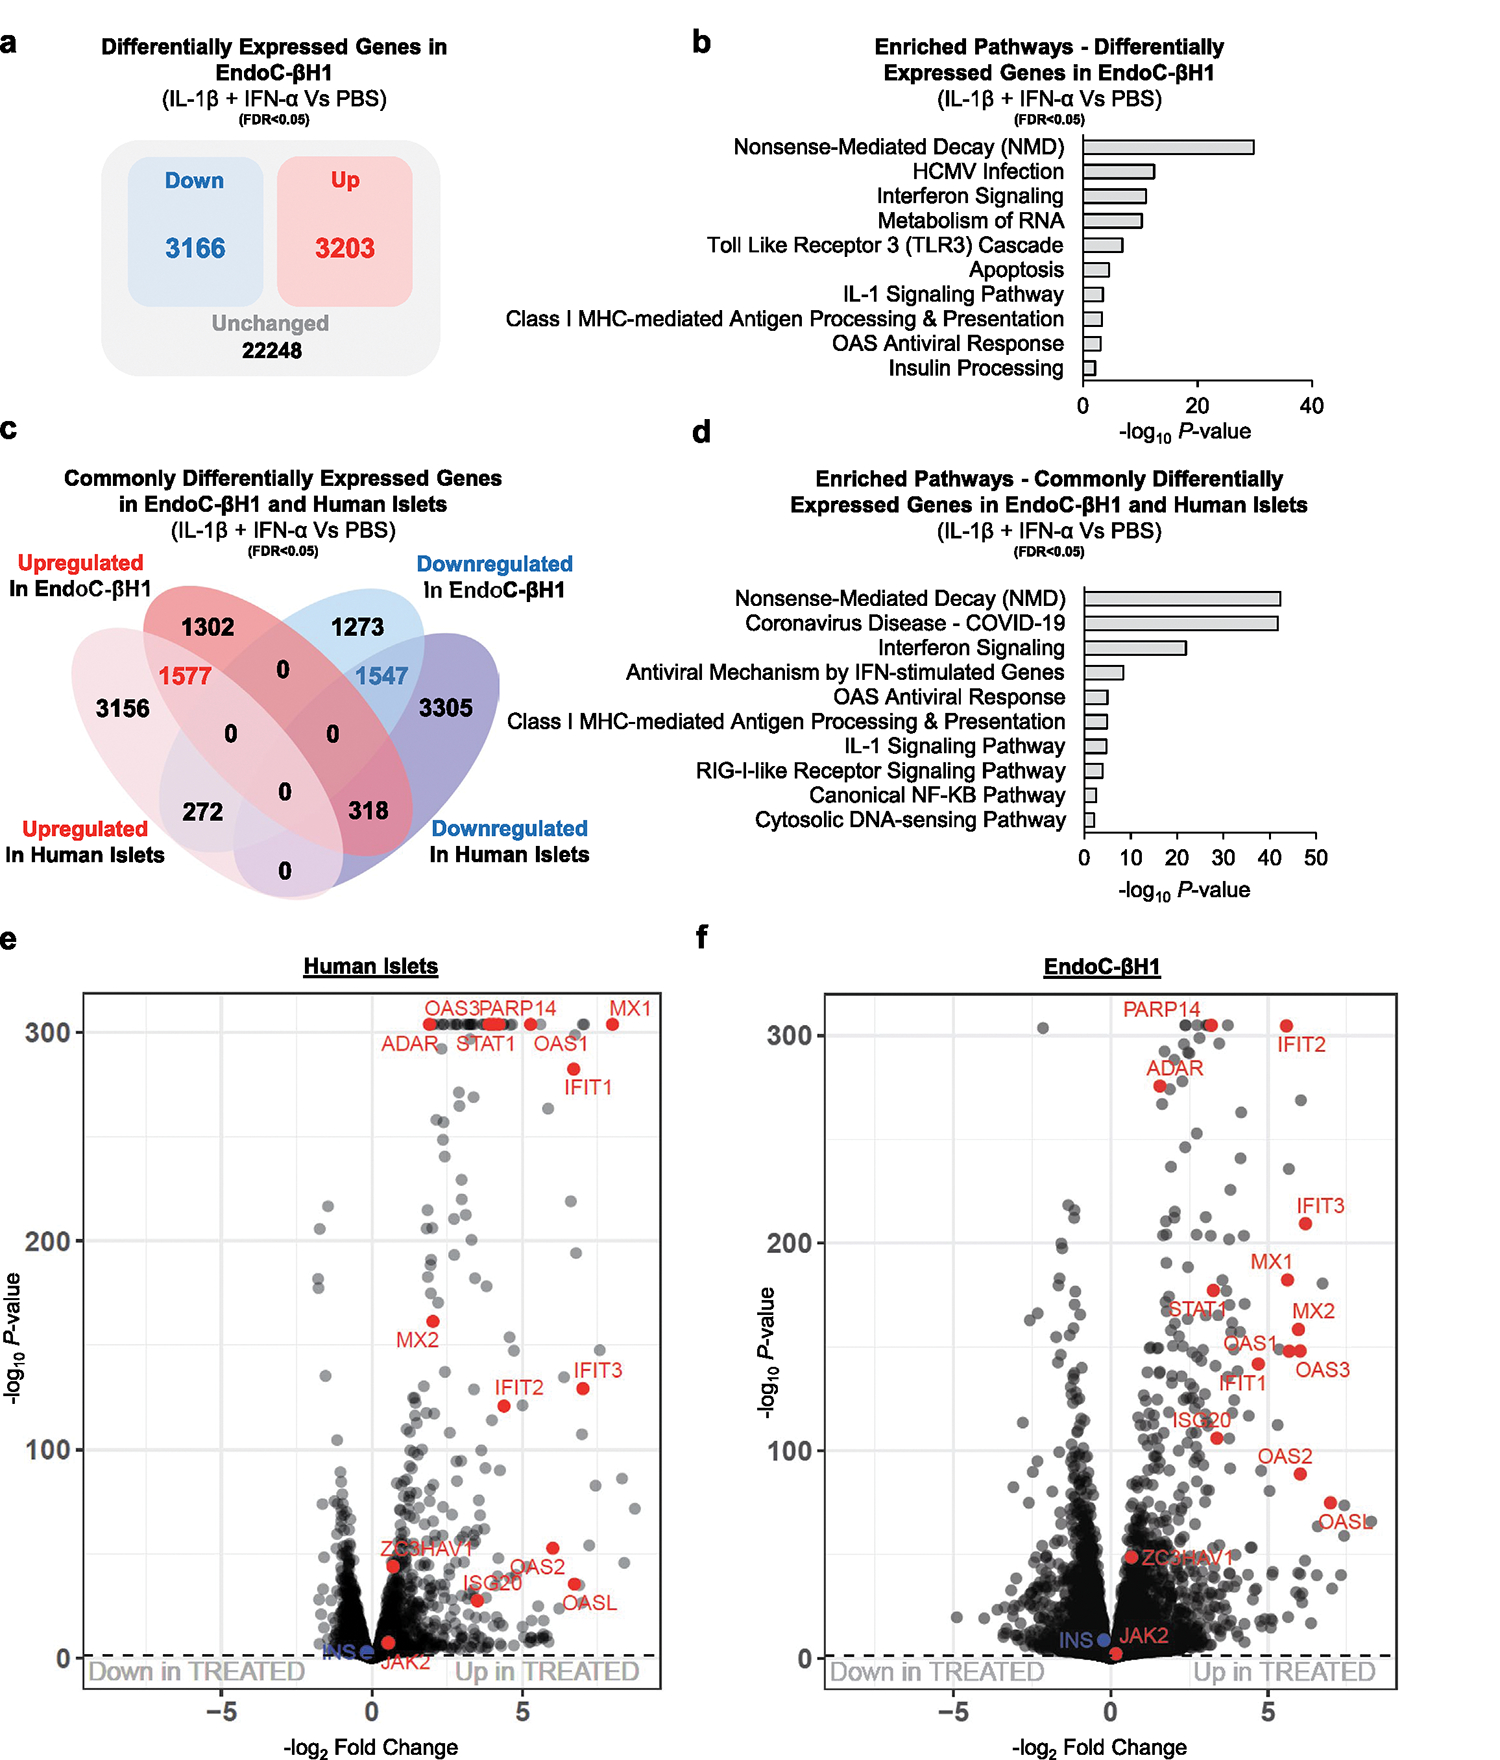
Extended Data Fig. 4 |. Human islets and EndoC-βH1 cells present an extensive overlap in the innate immune response to IL-1β and IFN-α (related to Figs. 3 and 4).

a, Diagram representation of the upregulated (red), downregulated (blue), and unchanged genes (black) in EndoC-βH1 cells treated with IL-1β and IFN-α compared to PBS. Statistical analyses were performed using the Benjamini-Hochberg procedure and genes were filtered for FDR<0.05. b, Pathway enrichment analyses of upregulated and downregulated genes in EndoC-βH1 cells treated with IL-1β and IFN-α compared to PBS. c, Venn diagram representation of the commonly upregulated (red), downregulated (blue), and unchanged genes (black) of the intersected genes in EndoC-βH1 and human islets cells treated with IL-1β and IFN-α compared to PBS. Statistical analyses were performed using the Benjamini-Hochberg procedure and genes were filtered for FDR<0.05. d, Pathway enrichment analyses of commonly upregulated and downregulated genes in human islets and EndoC-βH1 cells treated with IL-1β and IFN-α compared to PBS. e-f, Volcano-plot representation of differentially expressed genes in human islets (e) and EndoC-βH1 cells (f) treated with IL-1β and IFN-α compared to PBS. Innate immune genes are depicted in red and show a near absolute overlap between human islets and EndoC-βH1 cells. Human islets: n = 15 biologically independent samples. EndoC-βH1 cells: n = 6 independent experiments/group. Statistical analyses were performed using the Benjamini-Hochberg procedure. P values of pathway enrichment analysis were calculated according to the hypergeometric test based on the number of physical entities present in both the predefined set and user-specified list of physical entities. Source numerical data are available in source data.
