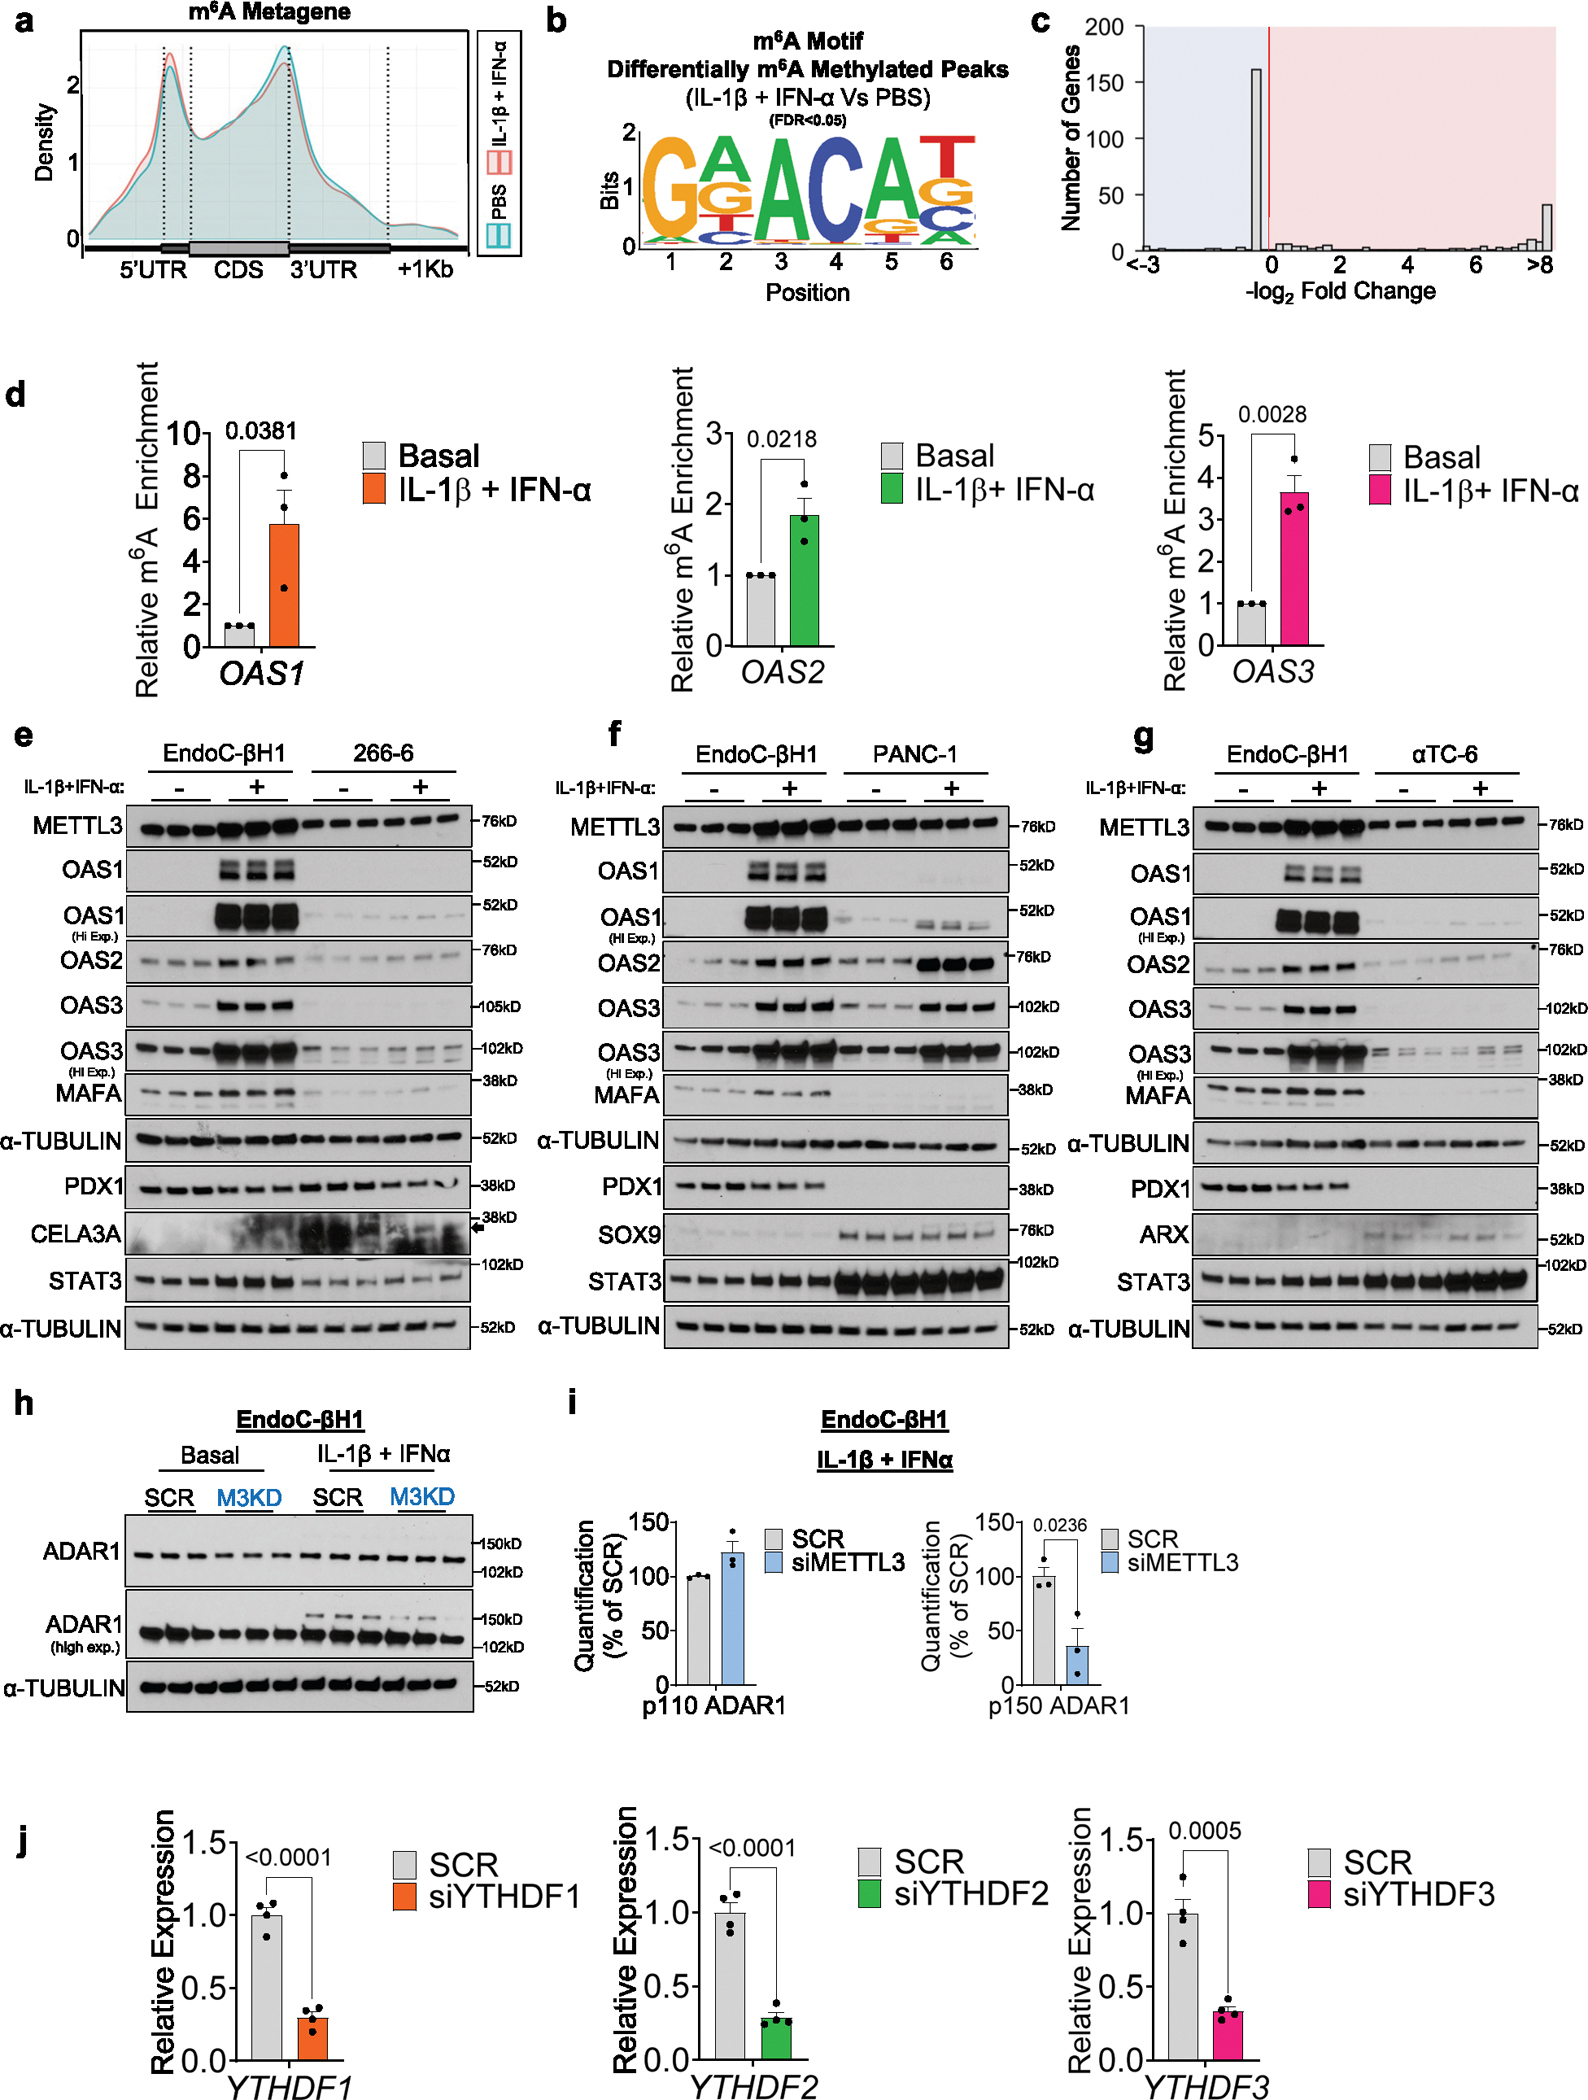
Extended Data Fig. 5 |. OAS upregulation is more prominent in β-cells, and METTL3 silencing leads to the downregulation of ADAR1 p150 isoform in β-cells (related to Fig. 4).

a, Metagene of m6A enriched peaks in PBS (blue) or IL-1β + IFN-α-treated (red) EndoC-βH1 cells. b, Enrichment for known m6A consensus motif RRACH. c, Histogram of the distribution of differential m6A loci log2 fold changes from IL-1β plus IFN-α-treated versus PBS in EndoC-βH1 cells. d, m6A-IP-qPCR showing increased m6A in OAS1, OAS2, and OAS3 in IL-1β + IFN-α-treated EndoC-βH1 cells compared to PBS (Basal) (n = 3 independent experiments/group). e-g, Western-blot analyses of indicated proteins in EndoC-βH1 cells and 266-6 cells (e), or PANC-1 (f), or αTC-6 (g) treated with PBS or IL1-β plus IFN-α for 24h (n = 3 independent experiments/group). h, Western-blot analyses of indicated proteins EndoC-βH1 cells harboring METTL3 silencing or Scramble and treated with PBS or IL1-β plus IFN-α (n = 3 independent experiments/group). Same experiment of Fig. 4h, with same loading control. i, Protein quantification of indicated proteins related to (h). j, qRT-PCR analyses of YTHDF genes after IL-1β plus IFN-α stimulation in scramble, YTHDF1, YTHDF2, or YTHDF3 KD EndoC-βH1 cells (n = 4 independent experiments/group). All samples in each panel are biologically independent. Data were expressed as means ± SEM. Statistical analysis was performed by two-tailed unpaired t-test. Source numerical data and unprocessed gel images are available in source data.
