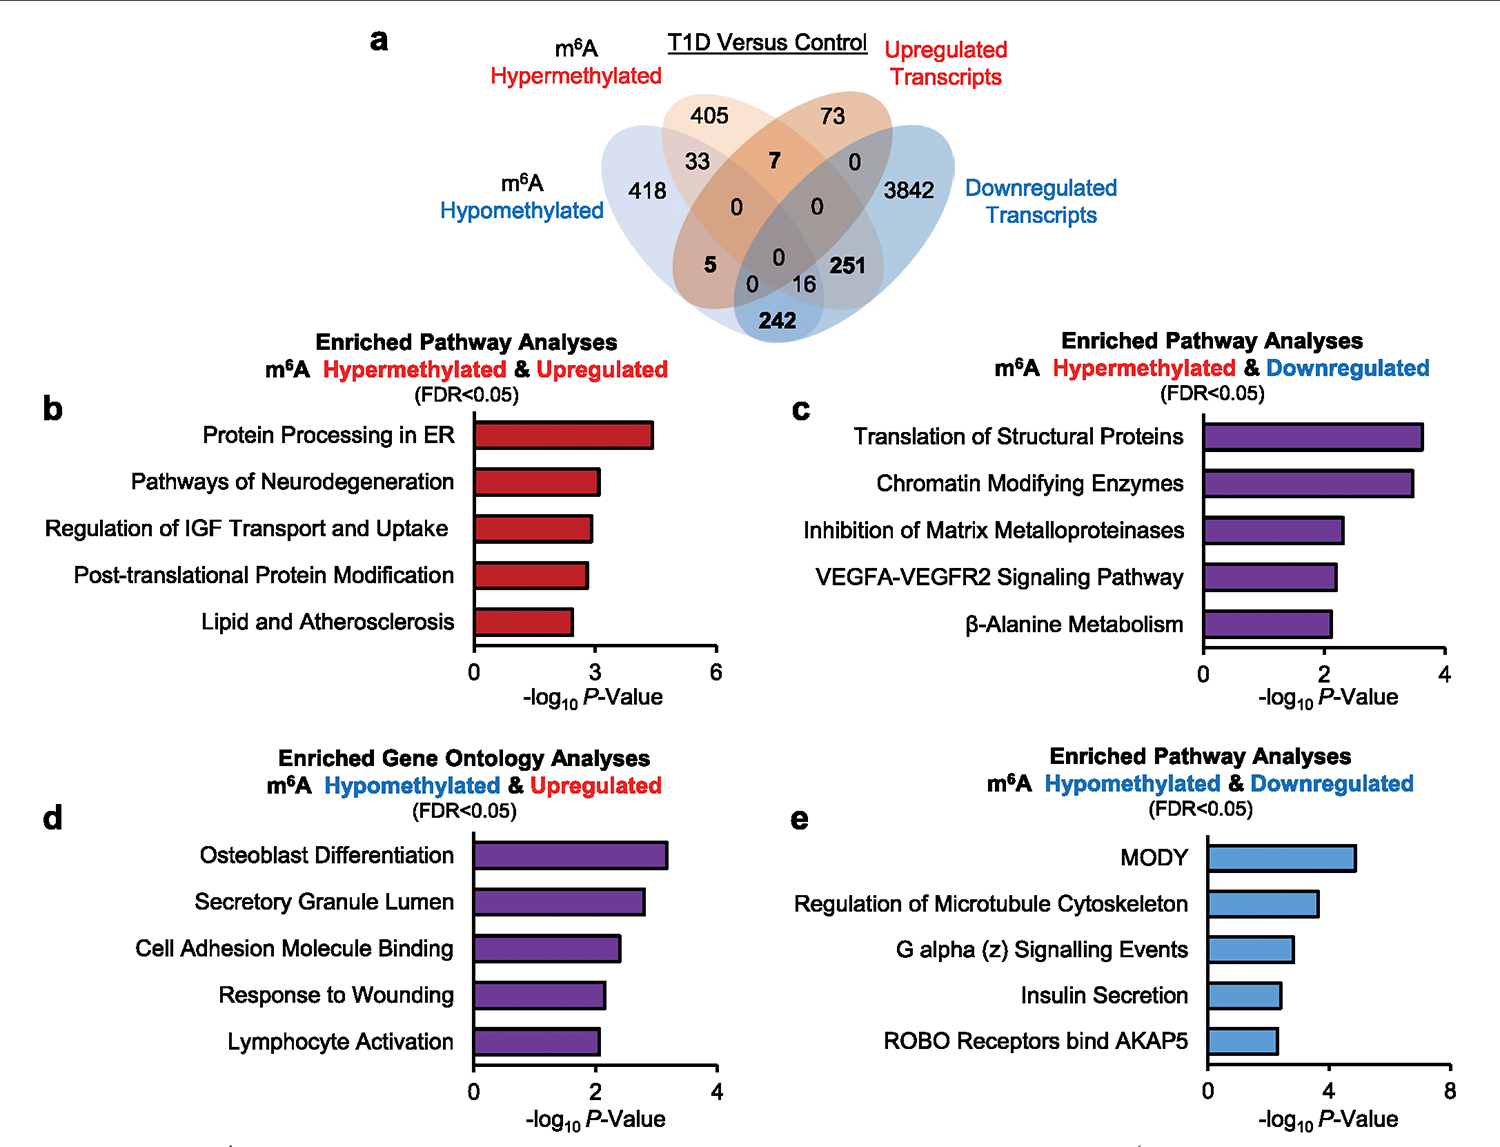
Extended Data Fig. 6 |. m6A landscape analyses of established T1D reveal differential methylation of master regulators of β-cell identity and function (related to Fig. 6).

a, Venn diagram representation of the m6A hypermethylated, m6A hypomethylated, upregulated, or downregulated genes in human islets from patients with established T1D or non-diabetic Controls. Statistical analyses were performed using the Benjamini-Hochberg procedure and genes were filtered for FDR<0.05. Human islets: Controls n = 20 and T1D n = 7 biologically independent samples. b-e, Pathway enrichment analyses of m6A hypermethylated and upregulated (a), m6A hypermethylated and downregulated (c), m6A hypomethylated and upregulated (d), or m6A hypomethylated and downregulated genes (e) in human islets from established T1D compared to Controls. P values of pathway enrichment analysis were calculated according to the hypergeometric test based on the number of physical entities present in both the predefined set and user-specified list of physical entities. Source numerical data are available in source data.
