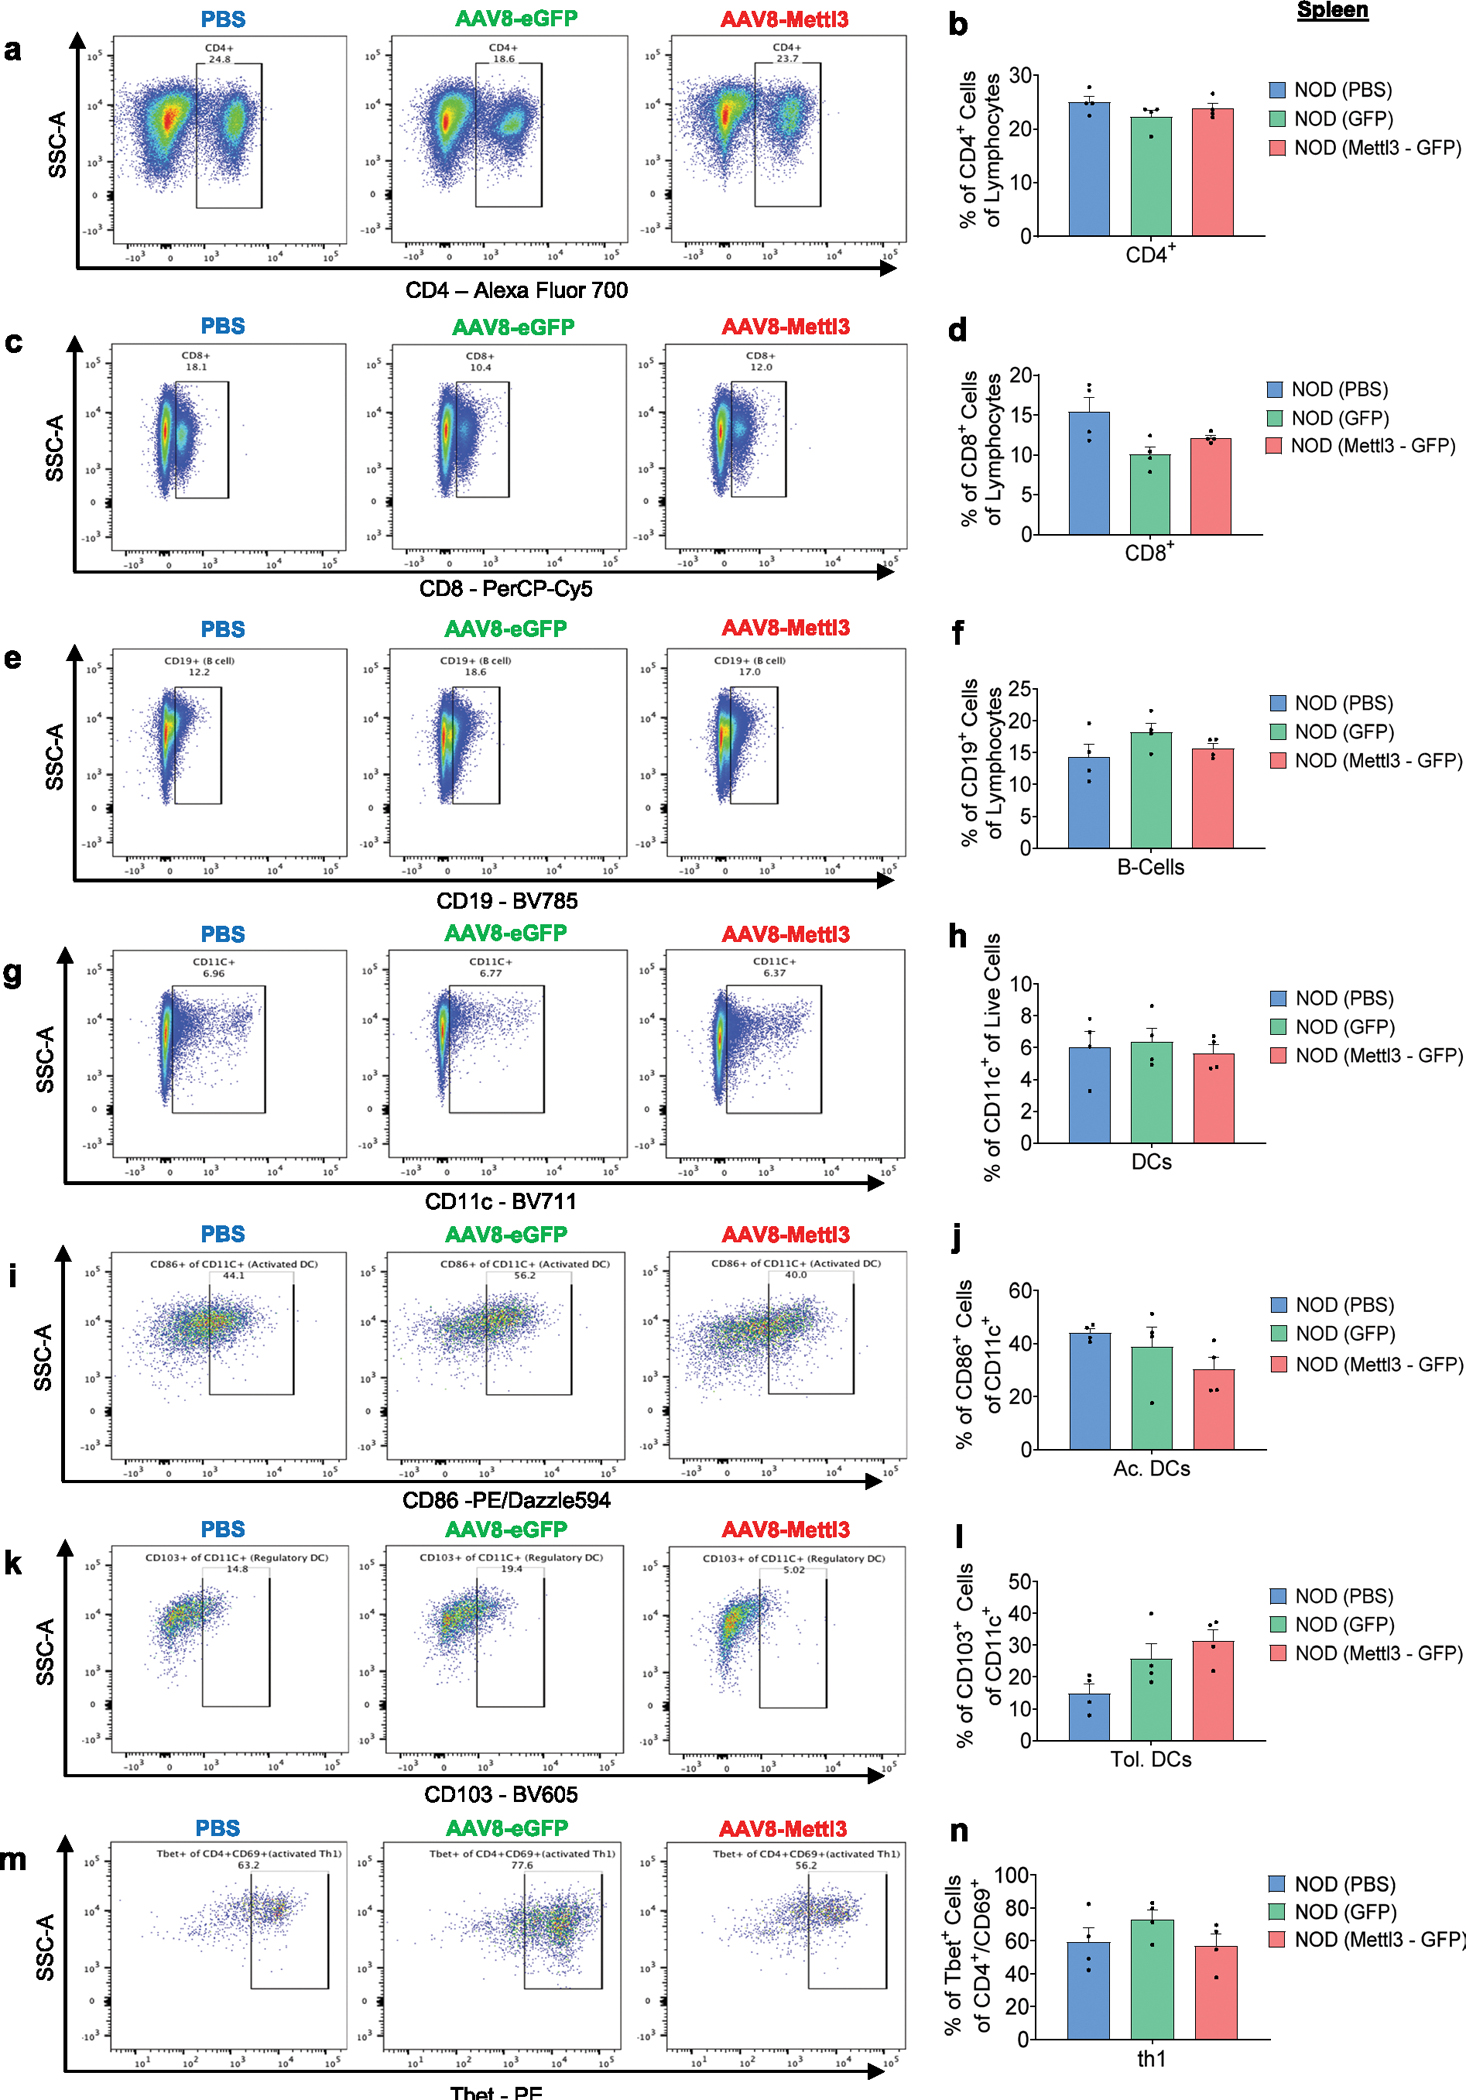
Extended Data Fig. 9 |. Immune cell profiling of NOD splenocytes (related to Fig. 7).

a-n, Flow cytometry analyses of CD4 (a,b), CD8 (c,d), B-cells (e,f), dendritic cells (g,h), activated dendritic cells (i,j), tolerogenic dendritic cells (k,l), or th1 cells (m,n) isolated from spleens of NOD mice receiving PBS, eGFP, or Mettl3 overexpression (n = 4 mice/group). All samples in each panel are biologically independent. Data were expressed as means ± SEM. Statistical analysis was performed by One-Way ANOVA with Holm-Sidak test. Source numerical data are available in source data.
