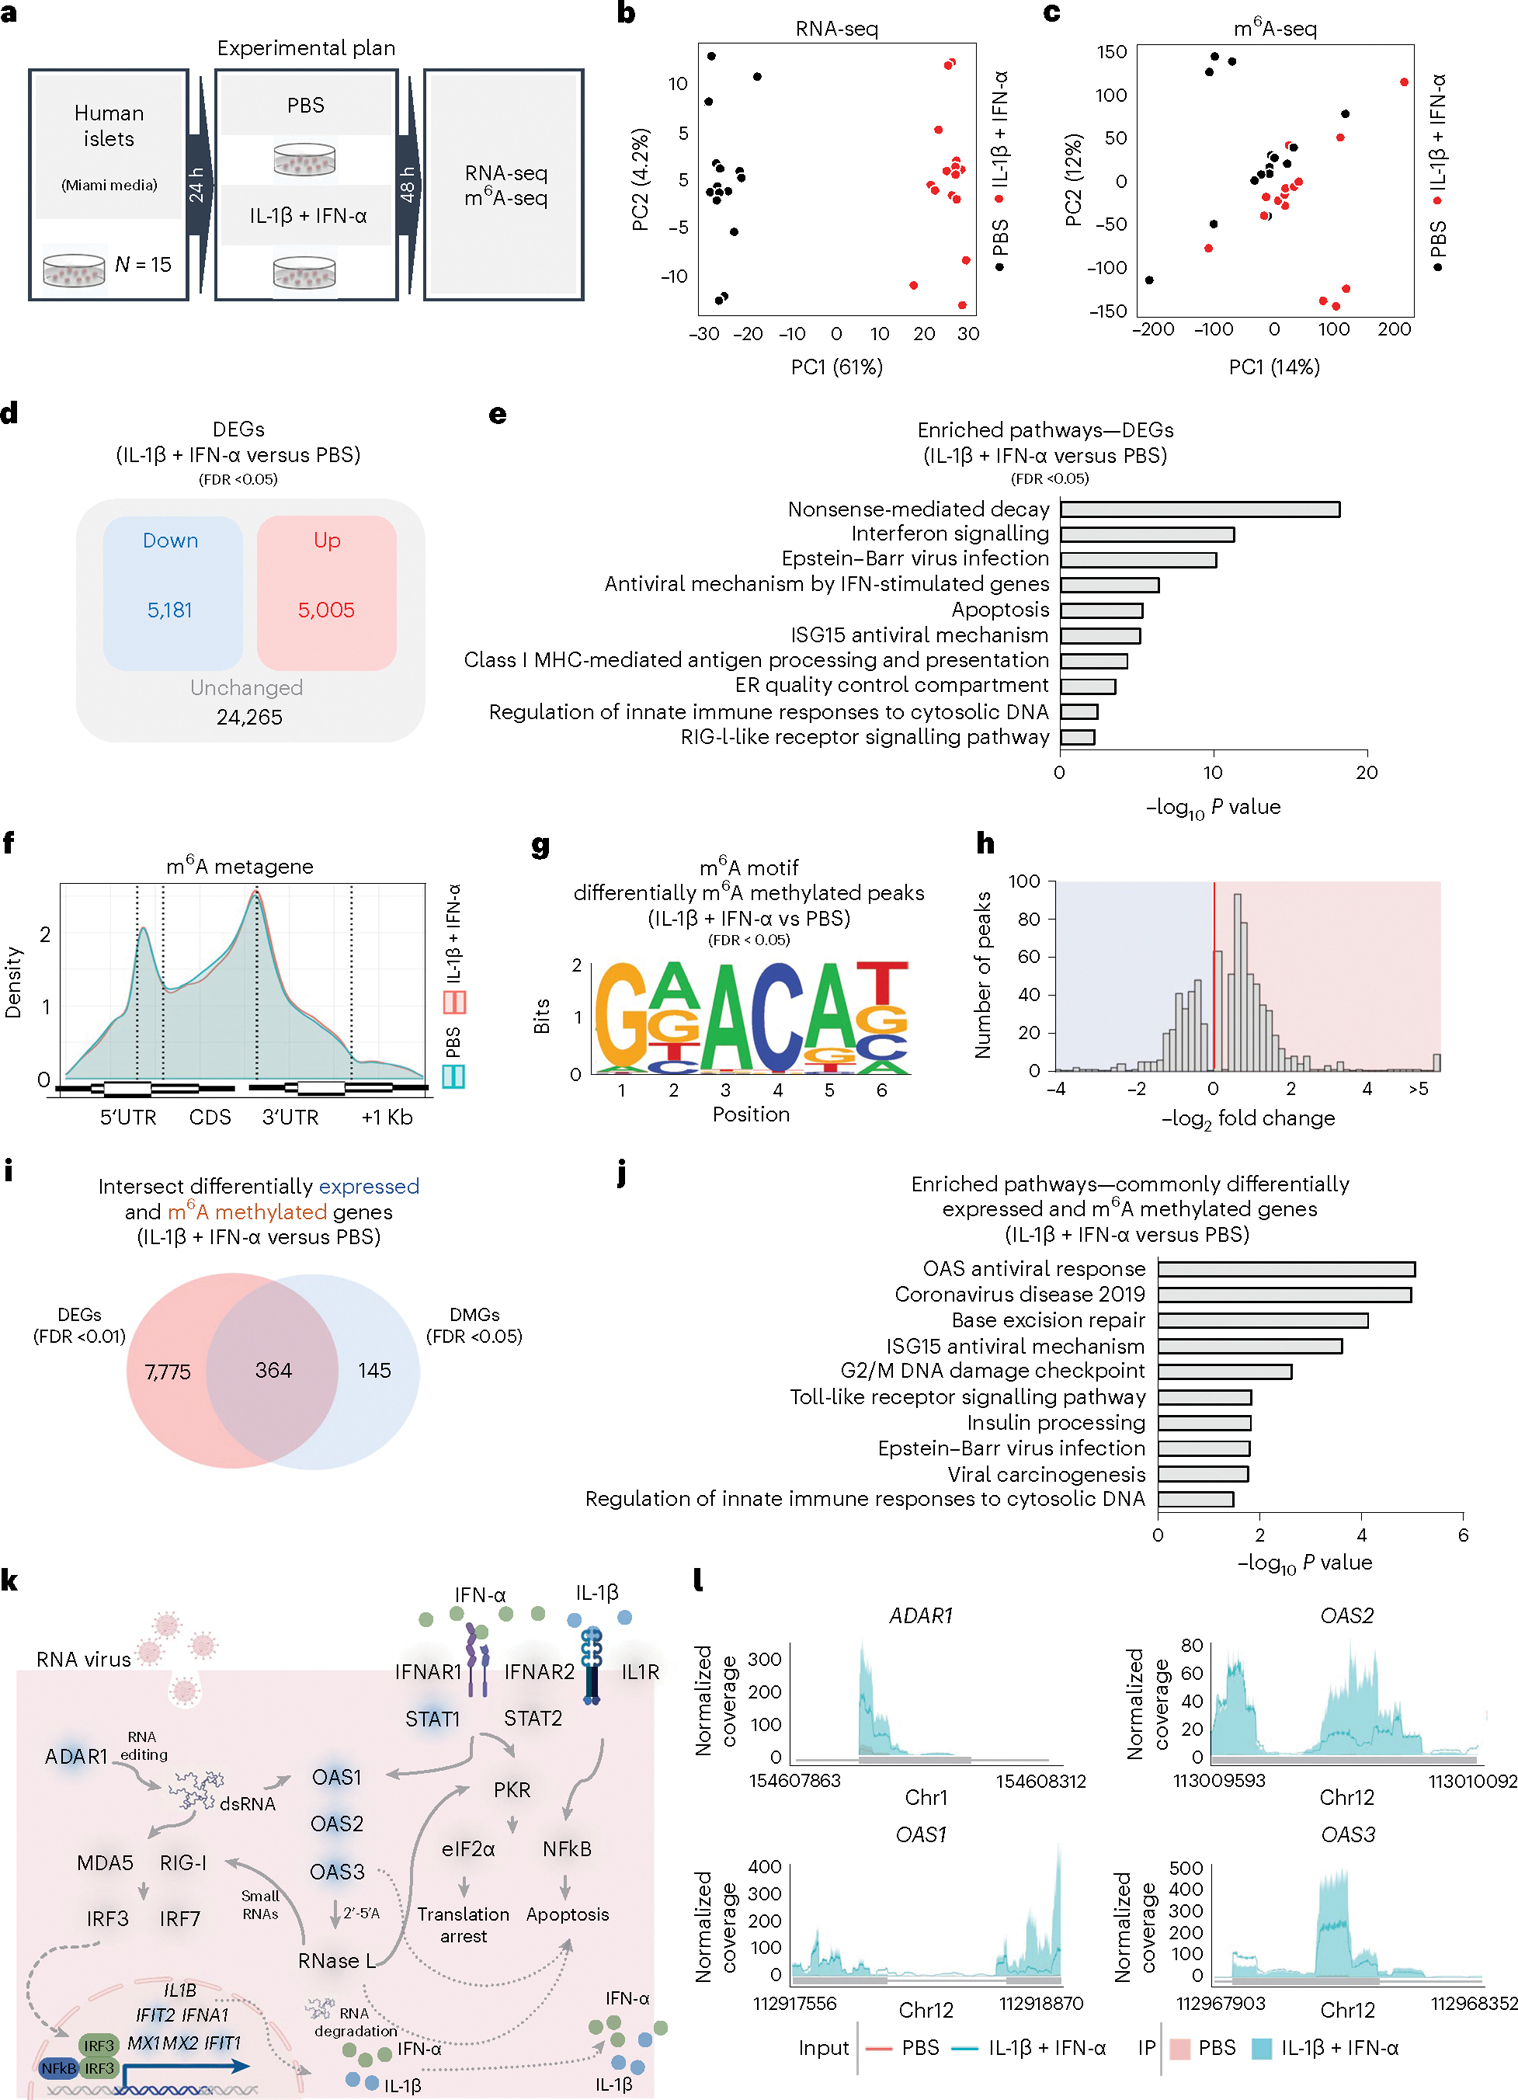
Fig. 3 |. m6A landscape analyses of human islets treated with IL-1β and IFN-α reveal hypermethylation of 2′,5′-OAS genes.

a, Summary scheme of the experimental plan. b, PCA plot of RNA-seq in human islets treated with PBS (black dots) or IL-1β and IFN-α (red dots) (n = 15 human patients). PC, principal component. c, PCA plot of m6A-seq in human islets treated with PBS (black dots) or IL-1β and IFN-α (red dots) (n = 15 human patients). d, Diagram representation of the upregulated (red), downregulated (blue) and unchanged genes (black) in human islets treated with IL-1β and IFN-α compared with PBS. Statistical analyses were performed using the Benjamini–Hochberg procedure and genes were filtered for FDR <0.05. e, Pathway enrichment analyses of upregulated and downregulated genes in human islets treated with IL-1β and IFN-α compared with PBS. f, Metagene of m6A enriched peaks in PBS- (blue) and IL-1β plus IFN-α-treated (red) human islets. CDS, coding sequence; UTR, untranslated region. g, Enrichment for known m6A consensus motif RRACH. h, Histogram of log2-fold change showing the distribution of differential m6A loci fold changes from IL-1β plus IFN-α-treated versus PBS. i, Venn diagram representation of the intersection between differentially methylated and expressed genes in human islets treated with IL-1β and IFN-α compared with PBS (n = 15 human patients). Statistical analyses were performed using the Benjamini–Hochberg procedure and DEGs were filtered for FDR <0.01 and m6A-methylated genes for FDR <0.05. j, Pathway enrichment analyses of intersected genes in i. k, Representation of antiviral innate immune pathway based on Kyoto encyclopedia of genes and genomes (KEGG) and Wikipathway annotations depicting several m6A hypermethylated genes (blue shade) and unchanged genes (grey shade) in human islets treated with IL-1β and IFN-α compared with PBS-treated (genes filtered for FDR <0.05). l, Coverage plots of m6A peaks in ADAR1, OAS1, OAS2 and OAS3 genes in human Islets treated with L-1β and IFN-α (blue) or PBS (red). Plotted coverages are the median of the n replicates presented. All samples in each panel are biologically independent. Pvalues of pathway enrichment analysis were calculated according to the hypergeometric test based on the number of physical entities present in both the pre-defined set and user-specified list of physical entities. Source numerical data are available in Source data.
