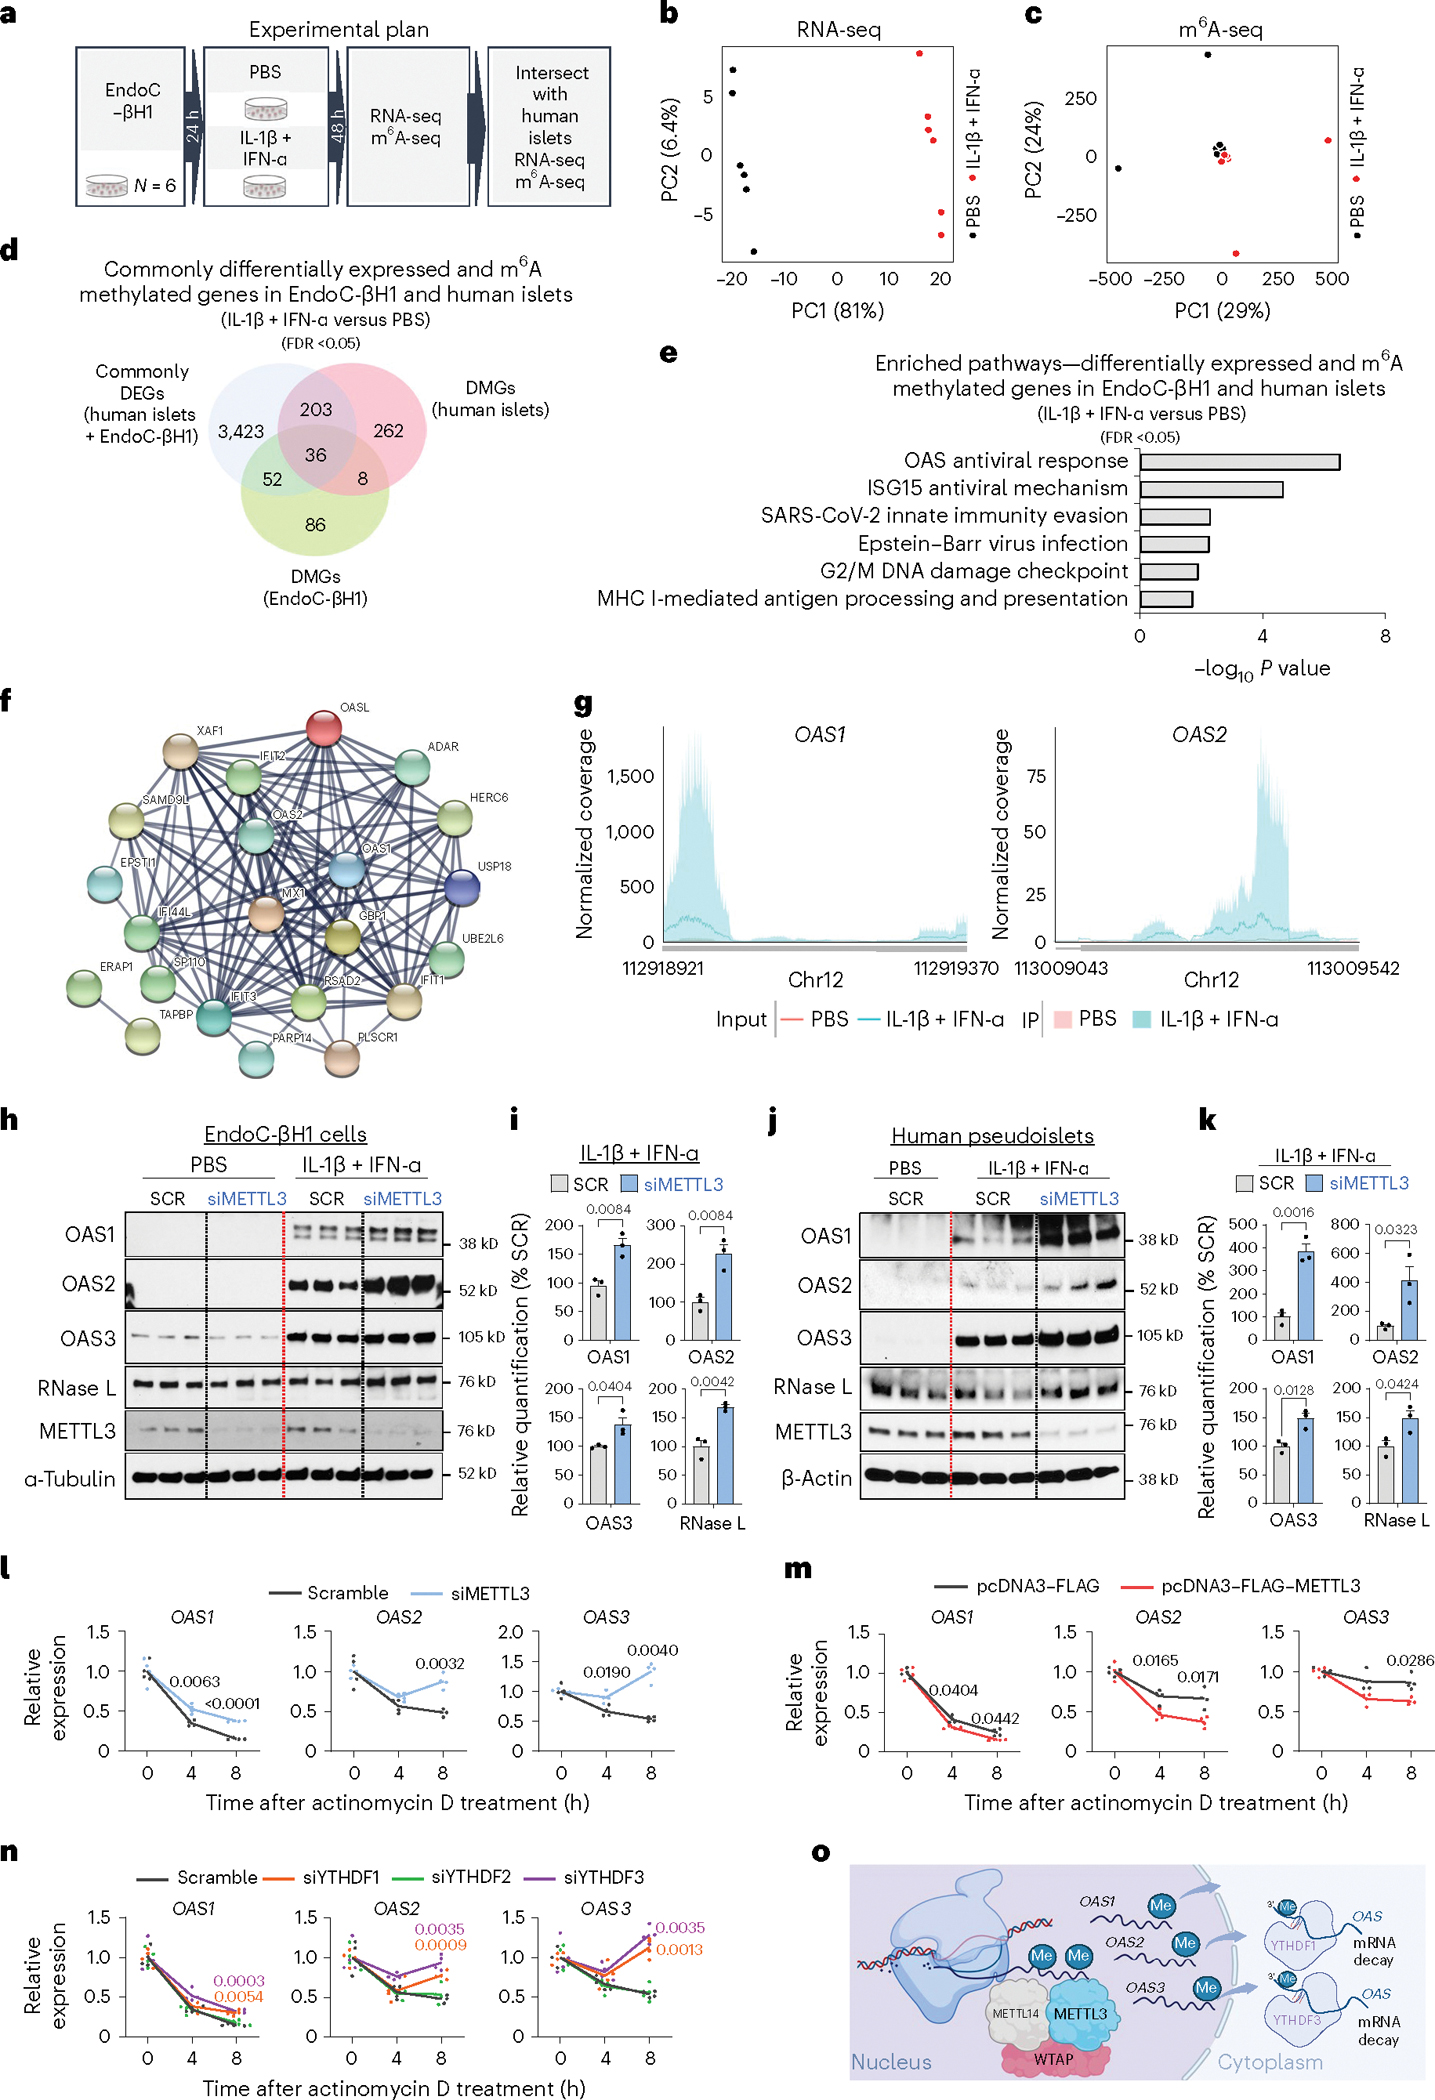
Fig. 4 |. m6A controls the mRNA stability of 2′–5′-OAS genes.

a, Summary scheme of experimental plan. b, PCA plot of RNA-seq in EndoC-βH1 cells treated with PBS (black dots) or IL-1β and IFN-α (red dots) (n = 6 independent experiments per group). PC, principal component. c, PCA plot of m6A-seq in EndoC-βH1 treated with PBS (black dots) or IL-1β and IFN-α (red dots) (n = 6 independent experiments per group). d, Venn diagram representation of the intersection between DEGs in human islets and EndoC-βH1 treated with IL-1β and IFN-α compared with PBS-treated with DMGs in human islets and EndoC-βH1 treated with IL-1β and IFN-α compared with PBS-treated. Statistical analyses were performed using the Benjamini–Hochberg procedure and genes were filtered for FDR <0.05. e, Pathway enrichment analyses of intersected genes in d. f, STRING functional protein–protein interaction network of 36 intersected genes, showing differential expression and m6A methylation in human islets and Endoc-βH1 cells treated with IL-1β and IFN-α compared with PBS. g, Coverage plots of m6A peaks in OAS1 and OAS2 genes in EndoC-βH1 cells treated with L-1β and IFN-α or PBS. Plotted coverages are the median of the n replicates presented. h, Western-blot analyses of indicated proteins after IL-1β plus IFN-α or PBS stimulation in EndoC-βH1 cells harbouring METTL3 KD or scramble (SCR) (n = 3 independent experiments per group). Same experiment of Extended Data Fig. 5h, with same loading control. i, Protein quantification of indicated protein in h. j, Western-blot analyses of indicated proteins after IL-1β plus IFN-α or PBS stimulation in human pseudoislets METTL3 KD or SCR (n = 3 biological independent samples). k, Protein quantification of indicated protein in j. l Quantitative reverse transcription (qRT)–PCR analyses of OAS genes after IL-1β plus IFN-α stimulation of METTL3 KD or scramble EndoC-βH1 cells after a time-course treatment with actinomycin D (ActD) (n = 4 independent experiments per group). m, qRT–PCR analyses of OAS genes after IL-1β plus IFN-α stimulation in METTL3-overexpressing (OE) and control (FLAG) EndoC-βH1 cells after a time-course treatment with ActD (n = 4 independent experiments per group). n, qRT–PCR analyses of OAS genes after IL-1β plus IFN-α stimulation in scramble, YTHDF1, YTHDF2 or YTHDF3 KD EndoC-βH1 cells after a time-course treatment with ActD (n = 4 independent experiments per group). o, Model depicting the role of METTL3-mediated m6A hypermethylation of OAS genes in response to IL-1β and IFN-α or at T1D onset that leads to OAS nuclear export to the β-cell cytoplasm and recognition by m6A readers YTHDF1 and YTHDF3 leading to accelerated mRNA decay. All samples in each panel are biologically independent. Data are expressed as mean ± standard error of the mean. Statistical analysis was performed by two-tailed unpaired t-test in i and k; two-way analysis of variance with Holm–Šídák’s multiple comparisons test in l–n; or as otherwise stated above. P values of pathway enrichment analysis were calculated according to the hypergeometric test based on the number of physical entities present in both the pre-defined set and user-specified list of physical entities. Source unprocessed gel images and numerical data are available in Source data.
