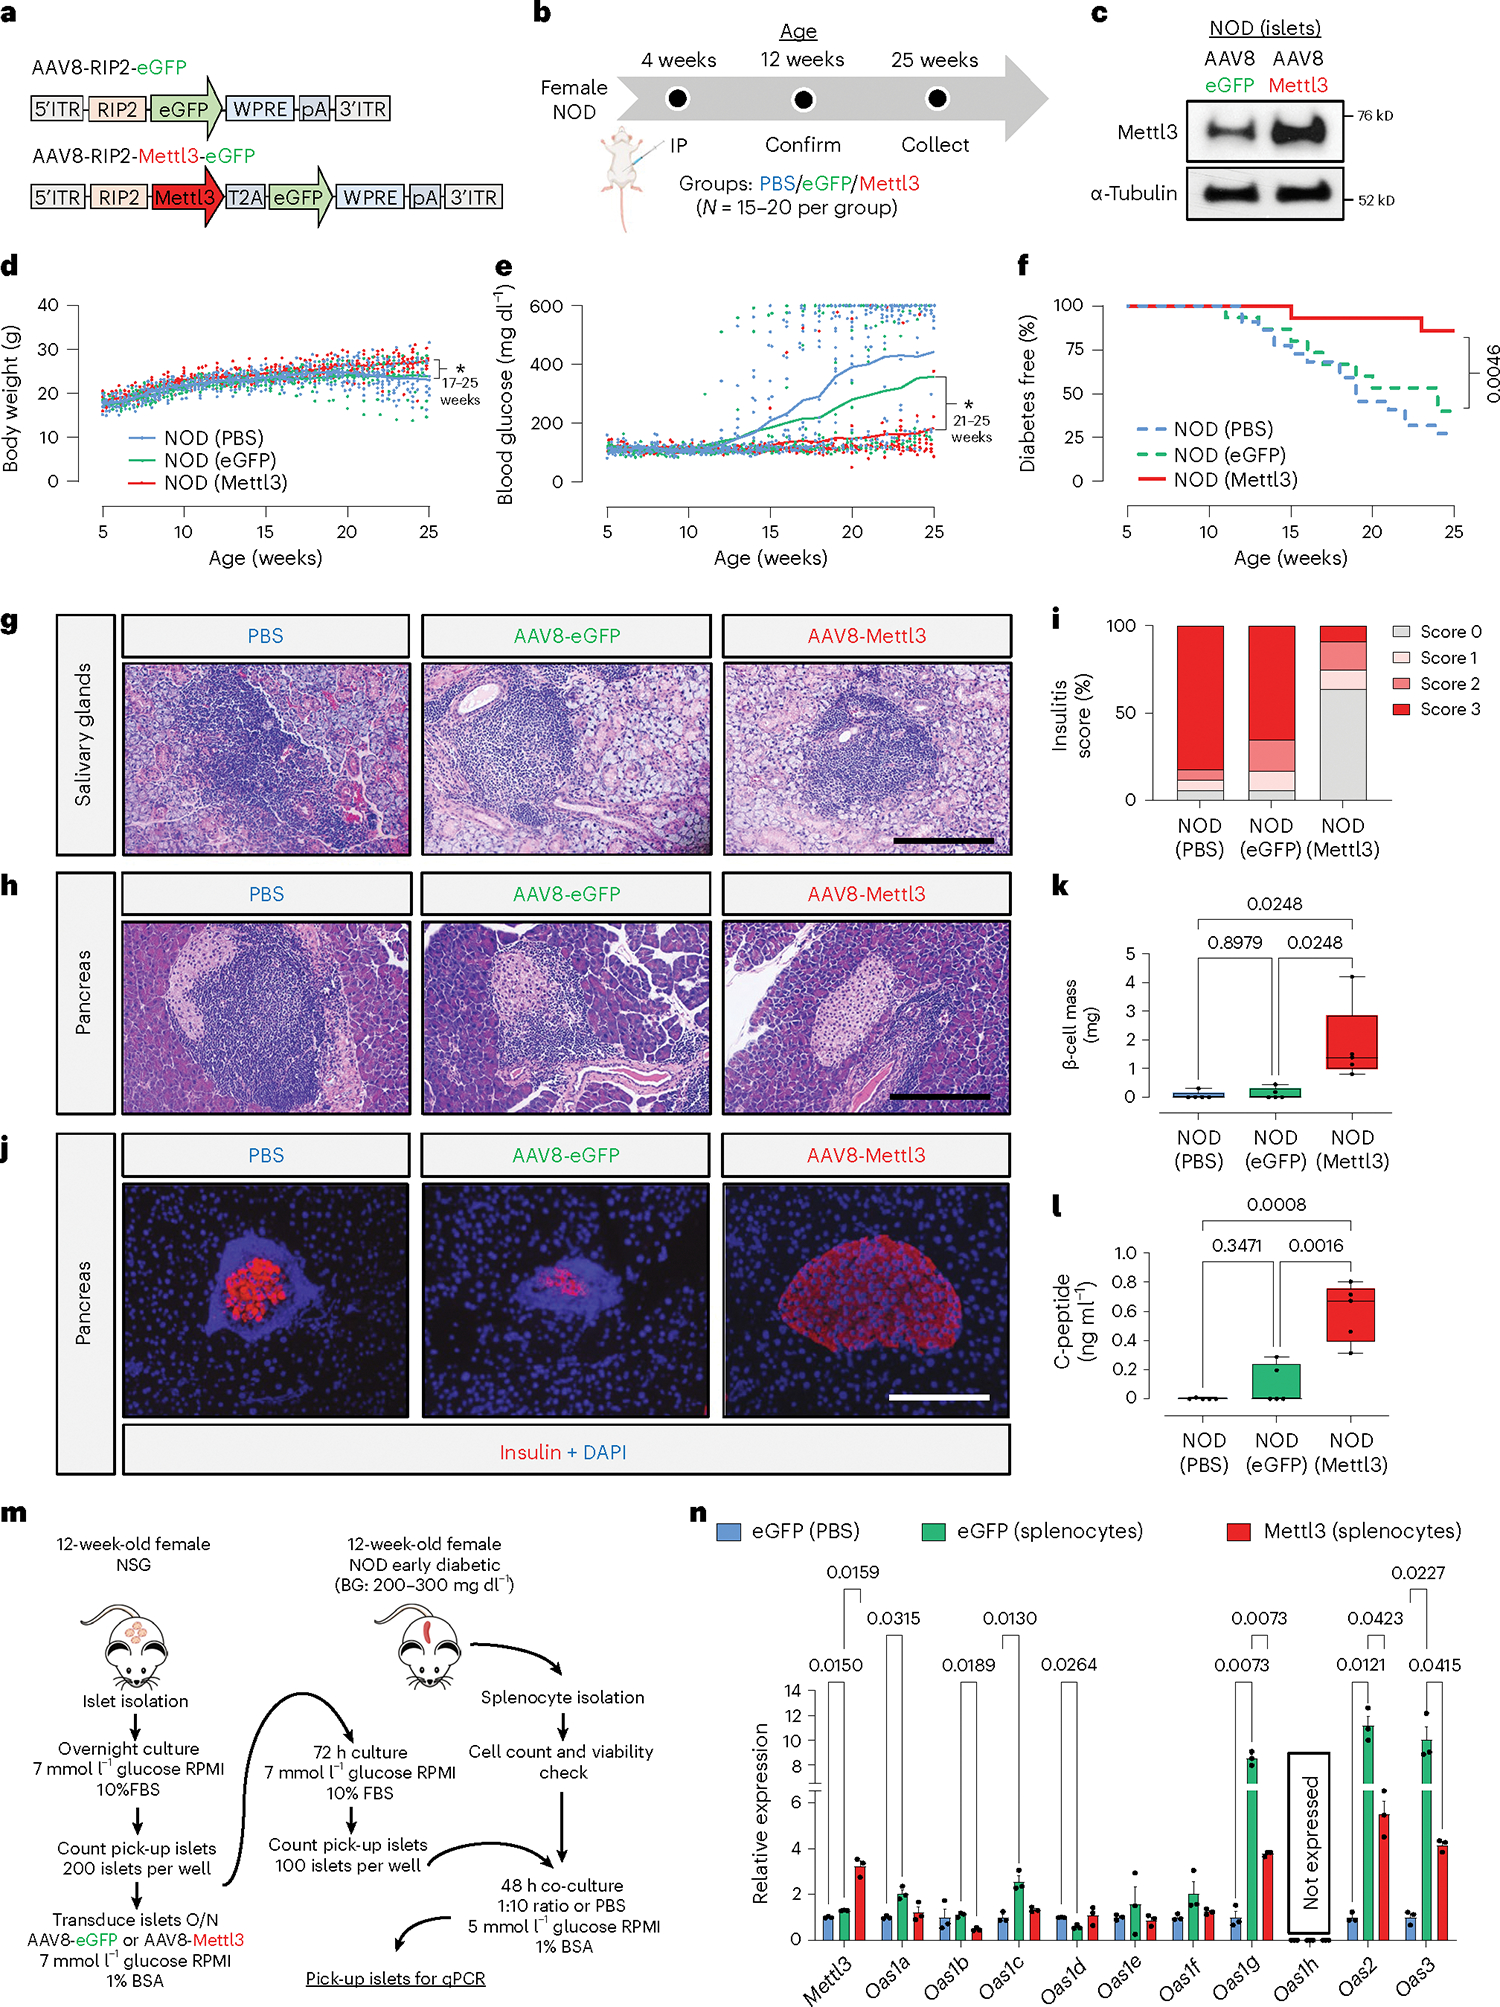
Fig. 7 |. In vivo AAV8-mediated overexpression of Mettl3 in NOD mouse β-cells delays T1D progression.

a, Schematic diagram showing the construction of AAV8 driving eGFP or Mettl3 under the control of a RIP2. b, Scheme of experimental approach depicting NOD mice receiving PBS (blue), AAV8 overexpressing eGFP (green) or AAV8 overexpressing Mettl3 (red). N = 20 mice in NOD (PBS), and n = 15 mice in NOD (eGFP) or NOD (Mettl3). c, Western-blot validation of Mettl3 overexpression in isolated NOD female islets after 8 weeks of in vivo transduction (n = 3 independent experiments). d, Body weight trajectories of NOD (PBS; blue dots/line), NOD (eGFP; green dots/line) and NOD (Mettl3; red dots/line) (P = 0.0215, 17 weeks of age; P = 0.0034, 25 weeks of age, NOD-PBS versus NOD-Mettl3). e, Blood glucose trajectories of NOD (PBS; blue dots/line), NOD (eGFP; green dots/line) and NOD (Mettl3; red dots/line) (P = 0.0239, 21 weeks of age; P = 0.0028, 25 weeks of age, NOD-PBS versus NOD-Mettl3). f, Percentage diabetes-free NOD (PBS), NOD (eGFP) and NOD (Mettl3) at the end of the 25 weeks of age. g, Representative haematoxylin and eosin (H&E) staining showing immune cell infiltration in salivary glands in NOD (PBS), NOD (eGFP) or NOD (Mettl3) (scale bar, 200 μm) (n = 5 mice per group). h, Representative H&E staining showing immune cell infiltration in pancreatic islets in NOD (PBS), NOD (eGFP) or NOD (Mettl3) (scale bar, 200 μm) (n = 5 mice per group). i, Quantification of insulitis score of pancreatic sections from h (n = 5 per group). j, Representative immunofluorescence images showing insulin (red) and DAPI (blue) in pancreatic sections from NOD (PBS), NOD (eGFP) or NOD (Mettl3) (scale bar, 200 μm). k, β-cell mass estimations of NOD (PBS), NOD (eGFP) and NOD (Mettl3) at 25 weeks of age (n = 5 mice per group). l, Serum C-peptide levels in NOD (PBS), NOD (eGFP) and NOD (Mettl3) at 25 weeks of age (n = 5 mice per group). m, Schematic representation of the co-culture experimental plan. BG, blood glucose. n, Quantitative reverse transcription PCR analyses of Oas genes in NSG islets transduced with eGFP and co-cultured with PBS (blue bars) or NOD diabetogenic splenocytes (green bars), or NSG islets transduced with AAV8 overexpressing Mettl3 and co-cultured with NOD diabetogenic splenocytes (red bars) (n = 3 per group; islets from 3 pools of 5 mice each pool). All samples in each panel are biologically independent. Data are expressed as mean ± standard error of the mean. Statistical analysis was performed by mixed-effects analysis with Dunnet’s multiple comparison test in d and Šídák’s multiple comparison test in e; log-rank (Mantel–Cox) test in f; two-way analysis of variance with Holm–Šídák’s multiple comparisons test in k, l and n. Source numerical data and unprocessed gel images are available in Source data.
