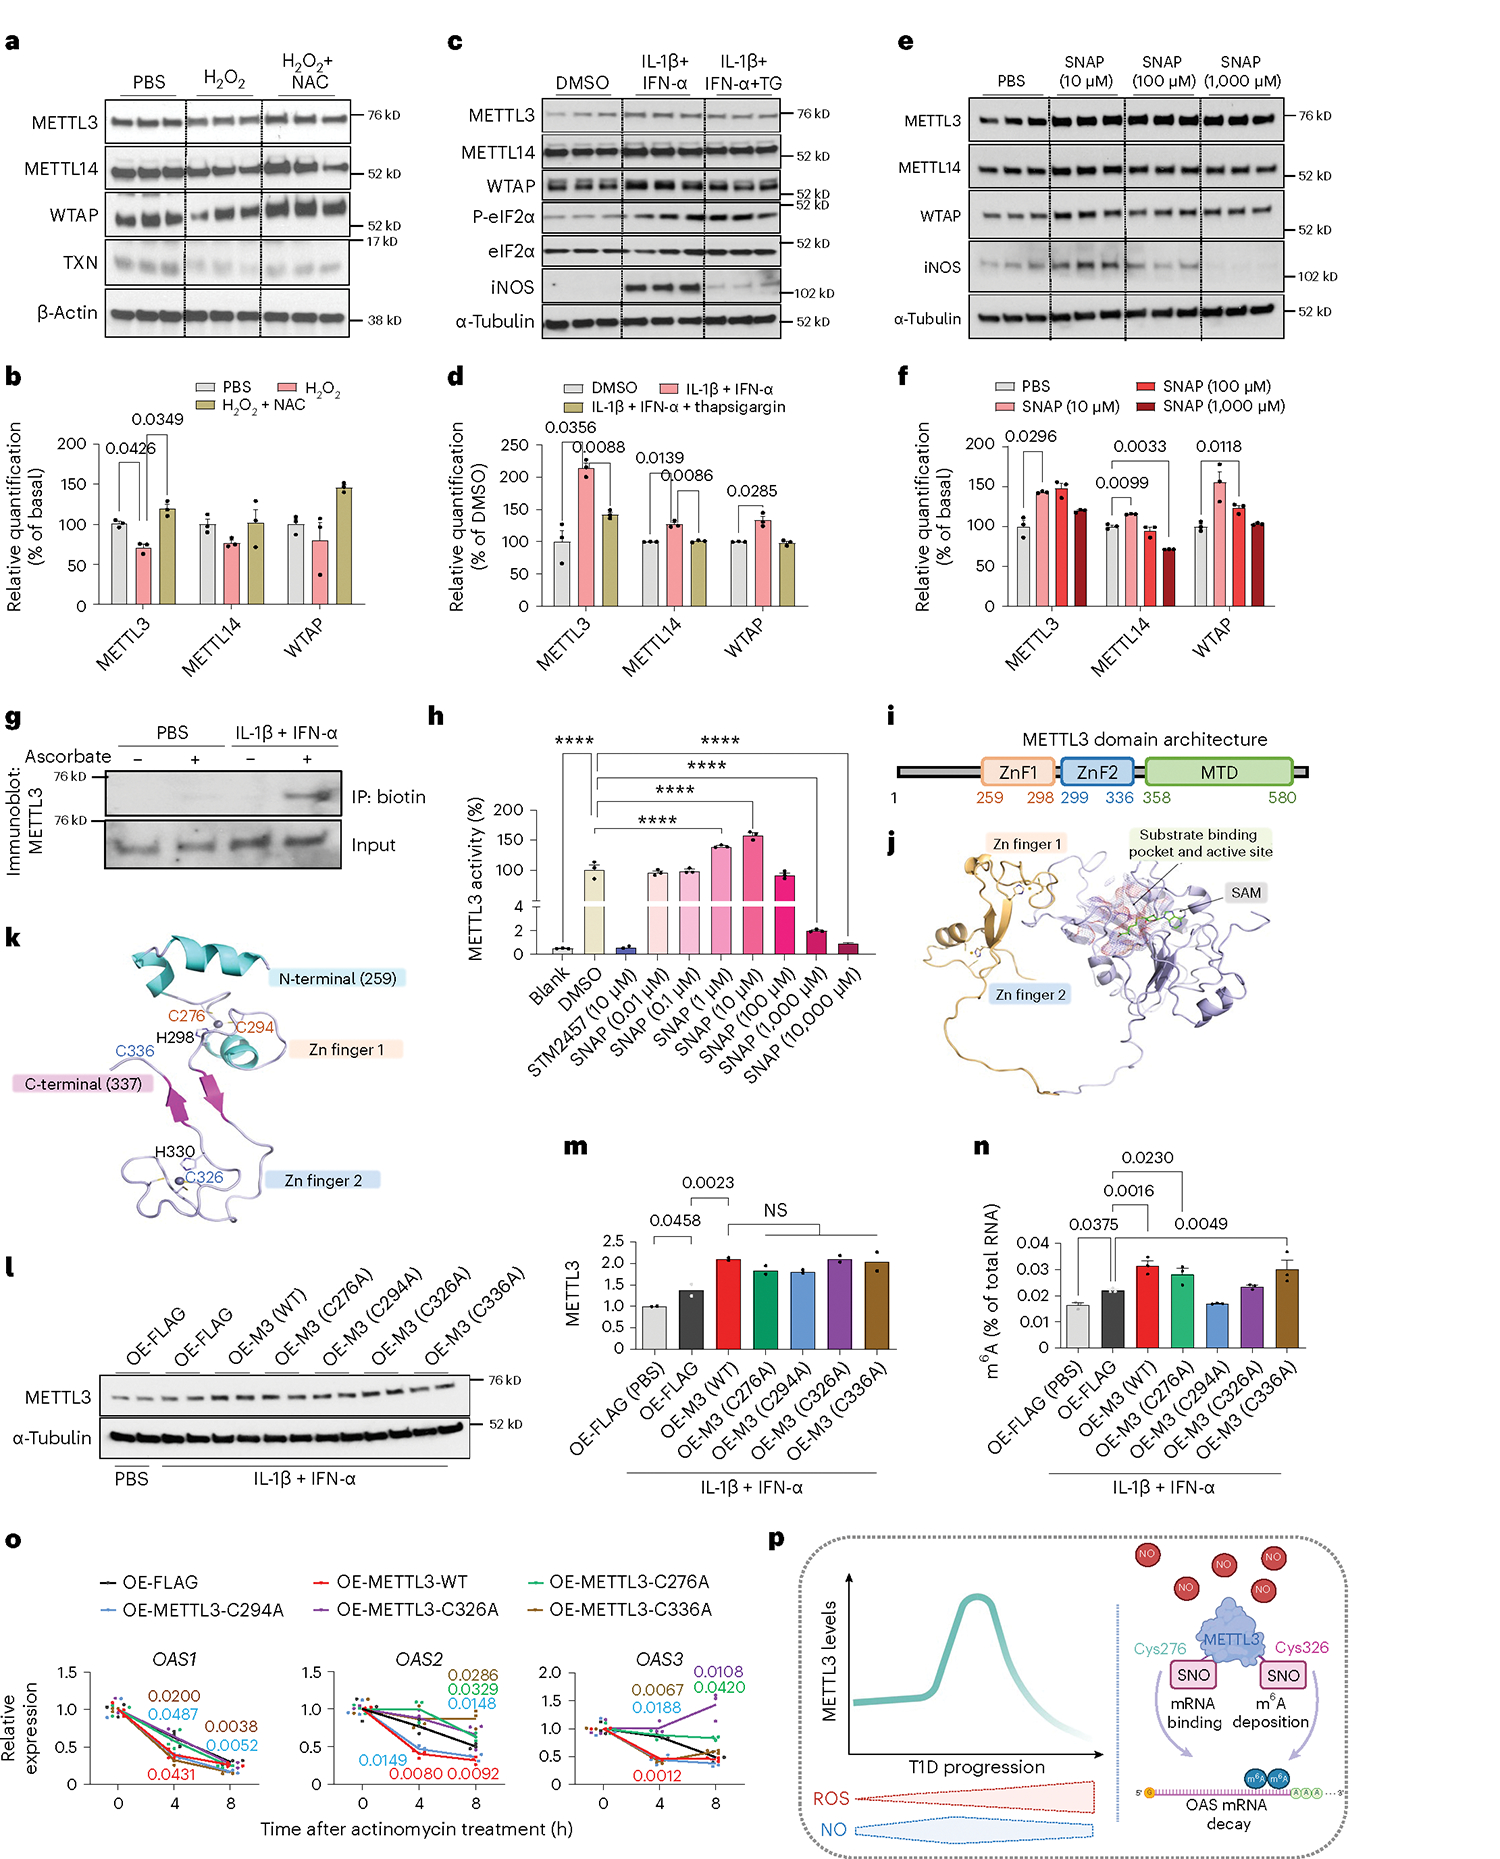
Fig. 8 |. OAS mRNA stability is regulated by the SNO of METTL3 in human β-cells.

a, Western-blot analyses of indicated proteins in human islet cells treated with H2O2 or H2O2 plus NAC for 24 h (n = 3 independent biological samples per group). b, Protein quantification of indicated proteins related to a. c, Western-blot analyses of indicated proteins in human islets treated with DMSO, IL-1β plus IFN-α pre-treated with thapsigargin plus IL-1β and IFN-α for a total of 24 h (n = 3 independent biological samples per group). d, Protein quantification of indicated proteins related to c. e, Western-blot analyses of indicated proteins in human islets treated with PBS or represented doses of SNAP for 24 h (n = 3 independent biological samples per group). f, Protein quantification of indicated proteins related to e. g, Western-blot analyses of biotin-switch assay on METTL3 in EndoC-βH1 cells treated with PBS or IL-1β plus IFN-α (n = 3 independent experiments per group). h, METTL3:METTL14 complex methyltransferase activity with DMSO, STM2457 (a METTL3 inhibitor) or different concentrations of SNAP (n = 3 independent experiments per group; n = 2 independent experiments/STM2457). **** P < 0.001. i,j, METTL3 protein domains representing zinc finger domains (ZnF) and MTD. k, Structure of METTL3 zinc finger domains depicting the identified cysteines sensitive to SNO. l, Western-blot analyses of METTL3 in EndoC-βH1 cells (n = 2 independent experiments per group). m, Protein quantification of METTL3 related to l. n, m6A levels measured by a colourimetric ELISA kit of total RNA isolated from EndoC-βH1 cells overexpressing the represented plasmids and treated with PBS or IL-1β plus IFN-α for 48 h (n = 3 independent experiments per group). NS, not significant. o, Quantitative reverse transcription PCR analyses of OAS genes after IL-1β plus IFN-α stimulation in EndoC-βH1 overexpressing the represented plasmids after a time-course treatment with actinomycin D (ActD) (n = 3 independent experiments per group). p, Model depicting the role of SNO in controlling METTL3 function and OAS mRNA decay. All samples in each panel are biologically independent. Data are expressed as mean ± standard error of the mean. Statistical analysis was performed by two-way analysis of variance (ANOVA) with Fisher’s least significant difference test or one-way with ANOVA Holm–Šídák’s test in h and n. Source numerical data and unprocessed gel images are available in Source data.
