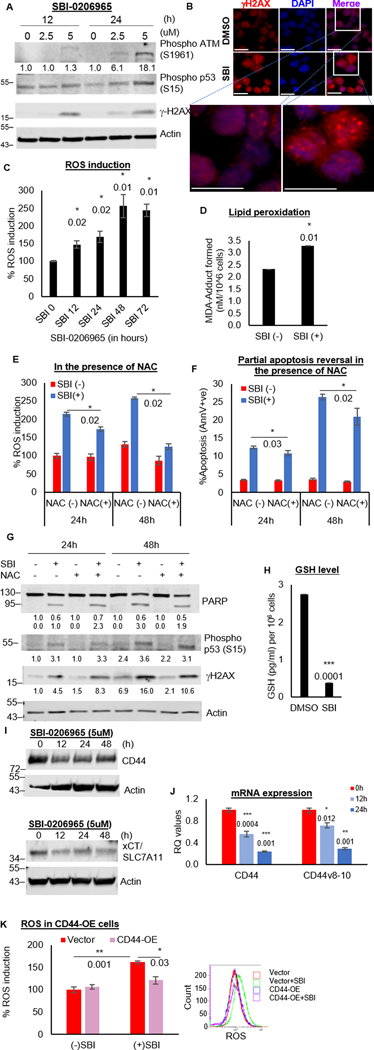
Figure 5. ULK1 inhibition impairs ROS mitigation.
(A) Western blot showing DNA damage markers in whole cell lysates of OCI-AML3 cells treated with SBI-0206965. (B) Representative images from immunofluorescence in OCI-AML3 cells treated with DMSO or SBI-0206965 (24 hours): 1O−γH2AX, 2O−donkey anti-rabbit AF594, Nuclei–DAPI, 40X magnification, scale bar 10 um. (C) Representative bar graphs showing percent ROS induction with respect to DMSO treated control cells as 100 (from triplicates ± SD) in OCI-AML3 cells treated with SBI-0206965. (D) Representative bar graphs showing MDA-adduct formed in nM/106 cells (from triplicates ± SD) to quantify lipid peroxidation (colorimetric estimation based on generated standard curve) in OCI-AML3 cells treated with/without SBI-0206965 (24 hours). (E-G) OCI-AML3 cells were treated with/without SBI-0206965, in the presence/absence of NAC (1mM), for 24 or 48 hours. Representative bar graphs showing percent ROS induction with respect to DMSO treated control cells as 100 (from triplicates ± SD) (E) and percent apoptosis (from triplicates ± SD) from Annexin V/DAPI assay (F), and western blot analysis for DNA damage markers (G). (H) Representative bar graphs to estimate reduced glutathione (GSH) in OCI-AML3 cells treated with/without SBI-0206965 (5uM) for 24 hours in GSH/GSSG assay (colorimetric estimation based on generated standard curve). Bar graphs represent the amount in pg/ml/106 cells (from triplicates ± SD). (I) Western blot analysis for CD44 and xCT (SLC7A11 gene product) in whole cell lysates of OCI-AML3 cells treated with SBI-0206965 (5uM). Actin was used as the loading control and for densitometric measurements for all western blots. It should be noted that WB for xCT in fig 5I and pERK1/2 in fig 4C were performed on the same blot and hence, both have the same actin. (J) Representative bar graphs (mean RQ value from triplicates ± SD) from qRT-PCR assay performed for CD44 and its variant (v8–10) on RNA isolated from OCI-AML3 cells treated with SBI-0206965 (5uM). RQ values generated from Ct values (2-ΔΔCt). (K) Representative bar graphs showing percent ROS induction with respect to DMSO treated vector control cells as 100 (from triplicates ± SD; top) and corresponding representative histograms (bottom) in OCI-AML3 cells transiently overexpressing either vector or CD44, treated with/without SBI-0206965 (24 hours). The statistical significance of all experiments was calculated by standard Student’s t-test and p-values are indicated in respective graphs.

