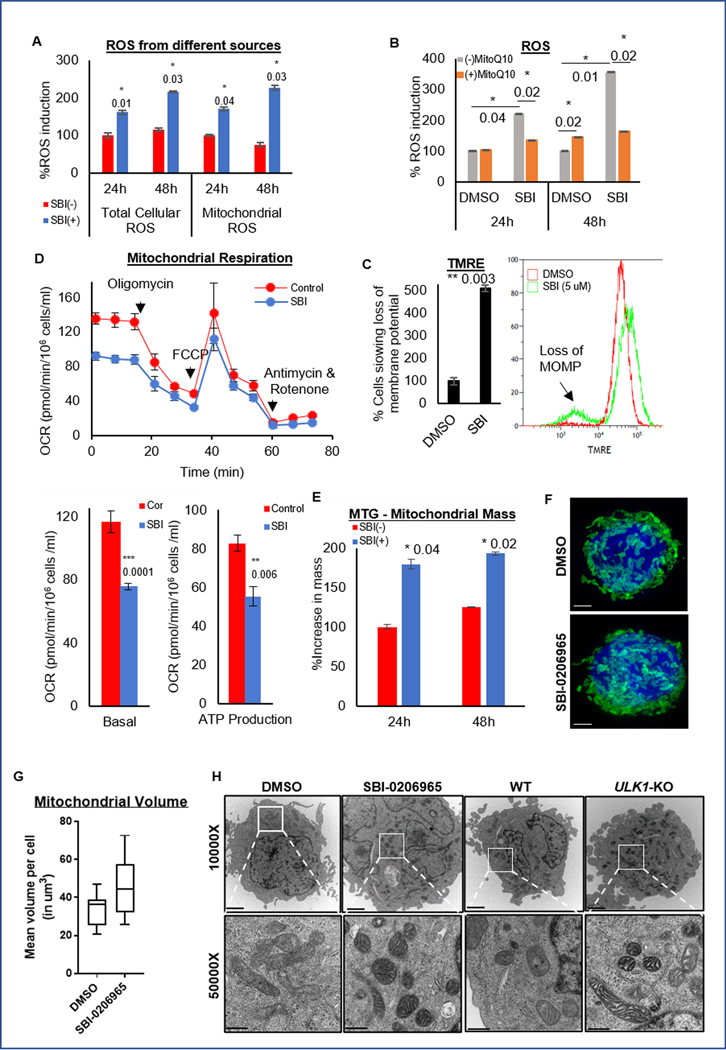
Figure 6. ULK1 inhibition causes mitochondrial dysfunction.
(A) Representative bar graphs showing percent of total cellular ROS and mitochondrial ROS induced with respect to the DMSO treated control cells as 100 (from triplicates ± SD) in OCI-AML3 cells were treated with or without SBI-0206965 for 24 or 48 hours using ROS-ID and MitoSOX assays respectively. (B) Representative bar graphs showing the percent ROS induced with respect to the DMSO treated control cells as 100 (from triplicates ± SD) in OCI-AML3 cells were treated with or without SBI-0206965, in the presence or absence of mitochondria specific antioxidant MitoQ10 (100 nM), for 24 or 48 hours. (C) Representative bar graph (mean percentage from triplicates ± SD) (left), with representative histograms (right) of TMRE assay to quantify loss of membrane potential in OCI-AML3 cells were treated with SBI-0206965 for 24 hours. (D) Representative line graph (mean value from triplicates ± SD) from the Seahorse Mito Stress test showing Oxygen Consumption Rate (OCR) in different phases of the reaction, in OCI-AML3 cells treated with SBI-0206965 for 24 hours (top). Representative bar graphs (from triplicates ± SD) to quantify basal respiration and ATP production (bottom). (E) Representative bar graphs (percent mean fluorescence intensity from triplicates ± SD) to quantify mitochondrial mass in OCI-AML3 cells treated with SBI-0206965 for 24 and 48 hours and stained with MitoTracker Green (MTG) dye and analyzed by flow cytometry. (F) Representative images from Super-Resolution Microscopy of OCI-AML3 with GFP-labeled mitochondria treated with SBI-0206965 for 24 hours. Images were acquired using the DeltaVision OMX Blaze V4 at 100X magnification (scale bar 5 um). (G) Box plot representing the total volume of mitochondria per cell, quantified by Imaris software. (H) Representative images from Transmission Electron Microscopy acquired at 10000X (upper panel: scale bar 2 um) and 50000X (lower panel: scale bar 500 nm) magnifications from OCI-AML3 cells treated with DMSO or SBI-0206965 for 24 hours, and control (WT) or ULK1-KO cells. The statistical significance of the experiments was calculated by standard Student’s t-test and p-values are indicated in respective graphs.

