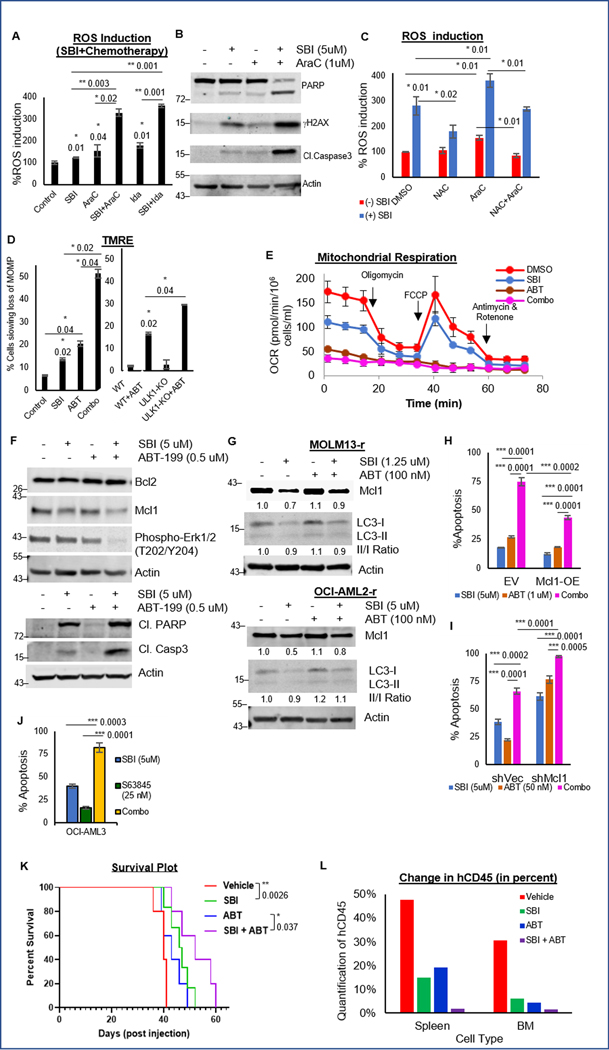
Figure 7. In vitro and in vivo synergy with ULK1 inhibition.
(A) Representative bar graphs showing percent ROS induction with respect to DMSO treated control cells as 100 (from triplicates ± SD) in OCI-AML3 cells treated with single agents AraC or Ida and in combination with SBI-0206965 (24 hours). (B) Western blot analysis for DNA damage markers in whole cell lysates of OCI-AML3 cells treated with single agents SBI-0206965 or AraC and in combination (24 hours). (C) Representative bar graphs showing percent ROS induction with respect to DMSO treated control cells as 100 (from triplicates ± SD) in OCI-AML3 cells treated with single agents SBI-0206965 or AraC and in combination, in presence/absence of NAC (24 hours). (D) Representative bar graphs (mean percentage from triplicates ± SD, TMRE assay) quantifying loss of membrane potential in OCI-AML3 cells treated with single agents SBI-0206965 or ABT-199, and in combination (24 hours, left); or in control (WT) and ULK1-KO cells treated with DMSO or ABT-199 (24 hours, right). (E) Representative line graph (mean value from triplicates ± SD, Seahorse Mito Stress test) showing Oxygen Consumption Rate (OCR) in OCI-AML3 cells treated with single agents SBI-0206965 (24 hours) or ABT-199 (2 hours), and in combination. (F) Western blot analysis in whole cell lysates of OCI-AML3 cells treated with single agents SBI-0206965 or ABT-199, and in combination (24 hours). (G) Western blot analysis for Mcl1 and LC3 in whole cell lysates of ABT-199 resistant cells treated with single agents SBI-0206965 or ABT-199, and in combination (24 hours). (H-I) Representative bar graphs showing percent apoptosis (from triplicates ± SD, Annexin V/DAPI assay) in empty vector or MCL1 overexpressing cells (H), and shControl or shMcl1 cells (I) treated with single agents SBI-0206965 or ABT-199, and in combination (72 hours). (J) Representative bar graphs showing percent apoptosis (from triplicates ± SD, Annexin V/DAPI assay) in OCI-AML3 cells treated with single agents SBI-0206965 or Mcl1 inhibitor (S63845), and in combination (72 hours). (K) Kaplan-Meier survival plot showing survival benefit of SBI-0206965 compared to control, and the benefit of adding SBI-0206965 to ABT-199. Indicated p-values were estimated by Mantel-Cox test. Median survival in days: vehicle (40), SBI-0206965 (47), ABT-199 (43) and combination (52). (L) Representative bar graph showing average percent human CD45+ve cells in spleen and bone marrow (flow cytometry), as a measure of tissue infiltration at the time of death. Actin was used as the loading control in all western blots. The statistical significance of all experiments (except in K) was calculated by standard Student’s t-test and p-values are indicated in respective graphs.

