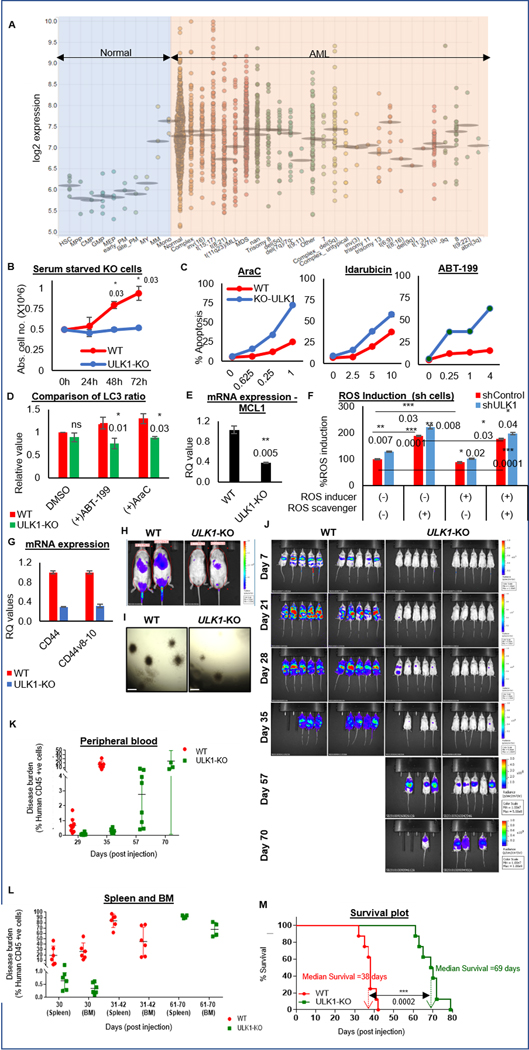
Figure 1. ULK1 is upregulated in AML, and its loss enhances therapy response in vitro and delays leukemia progression in vivo.
(A) Dot plot representation comparing ULK1 gene expression from curated microarray-based gene expression profiles of human AML (GSE13159, GSE15434, GSE61804, GSE14468, and The Cancer Genome Atlas) and FACS-sorted healthy hematopoietic cells in different stages of maturation (GSE42519), generated using the Bloodspot server and database. (B) Representative line graphs showing absolute cell numbers (from triplicates ± SD) measured by Trypan Blue staining using a Vi-Cell counter in control (WT) and ULK1-KO cells cultured simultaneously under serum starved conditions. Cells were collected every 24 hours. (C) Representative line graphs showing percent apoptosis (from triplicates ± SD) from Annexin V/DAPI assay in WT and ULK1-KO cells simultaneously treated with increasing doses as indicated of either AraC (left), Ida (middle) or ABT-199 (right) for 72 hours. (D) Representative bar graphs showing comparative analysis of LC3 ratio in whole cell lysates of control (WT) and ULK1-KO (KO) cells, treated with DMSO, AraC or ABT-199 (calculated from triplicates ± SD, in LC3-PE flow cytometry). Actin was used as the loading control and for densitometric measurements. (E) Representative bar graphs showing mean RQ values (from triplicates ± SD) from qRT-PCR assay performed for MCL1, on RNA isolated from control (WT) or ULK1-KO cells. (F) Representative bar graphs showing the percent ROS induced with respect to untreated shControl cells as 100 (from triplicates ± SD), in shControl and shULK1 cells, either untreated, or in the presence of ROS inducer (Pyocyanin) and/or ROS scavenger (NAC). (G) Representative bar graphs showing mean RQ values (from triplicates ± SD) from qRT-PCR assay performed for CD44 and its variant v8–10, on RNA isolated from control (WT) or ULK1-KO cells. All RQ values were generated from Ct values (2-ΔΔCt). (H) Representative images from bioluminescence imaging (BLI) performed 16 hours post-injection to analyze homing of the injected cells in mice. (I) Representative images of colony formation assay performed in control (WT) and ULK1-KO cells (4X magnification, 500 um scale bar). (J) BLI showing disease progression in 6-week old male NSG mice injected with luciferized control (WT) or ULK1-KO cells (106 cells each) via tail vein injection (n>10) over time. (K) Representative dot plot showing the percent of circulating human CD45+ve cells in individual mice at indicated time points by flow cytometry from peripheral blood, to measure the disease burden over the course of the experiment. (L) Representative dot plot showing the percentage of human CD45+ve cells in individual mice at indicated time points by flow cytometry from different organs (spleen and bone marrow), to measure the disease burden over the course of the experiment. (M) Kaplan-Meier survival plot showing survival benefit of ULK1-KO in comparison to control. The values were estimated by Mantel-Cox test showing a p-value of 0.0001 and median survival was 38 days for WT and 69 days for ULK1-KO group. Statistical significance of the experiments was calculated by standard Student’s t-test and p-values are indicated in respective graphs.

