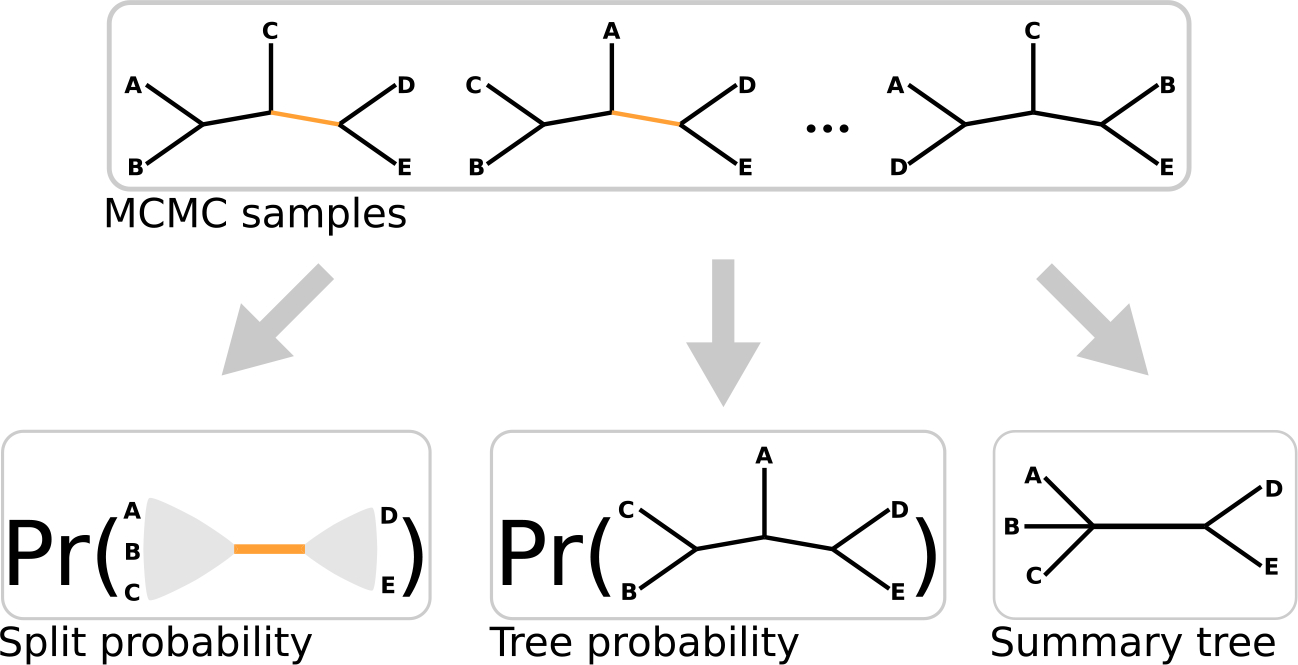
Figure 1:

A cartoon depiction of a set of MCMC samples of a phylogenetic tree topology on five tips and the three summaries of the posterior distribution on trees we consider in this study. Split probabilities (left) are estimated by the fraction of MCMC samples which have a given bipartition of taxa, marginalizing out the rest of the tree topology. The depicted split partitions the tips into the tip-sets and (the edge corresponding to this split is colored orange in the MCMC samples). Tree probabilities (center) are estimated by the fraction of MCMC samples which have a given tree topology. Summary trees (right) are single trees which serve as a point estimate for all trees. Some, like the MRC tree, may not be fully resolved. The depicted MRC tree is unresolved (does not establish the particular topology with respect to) for the tip-set .
