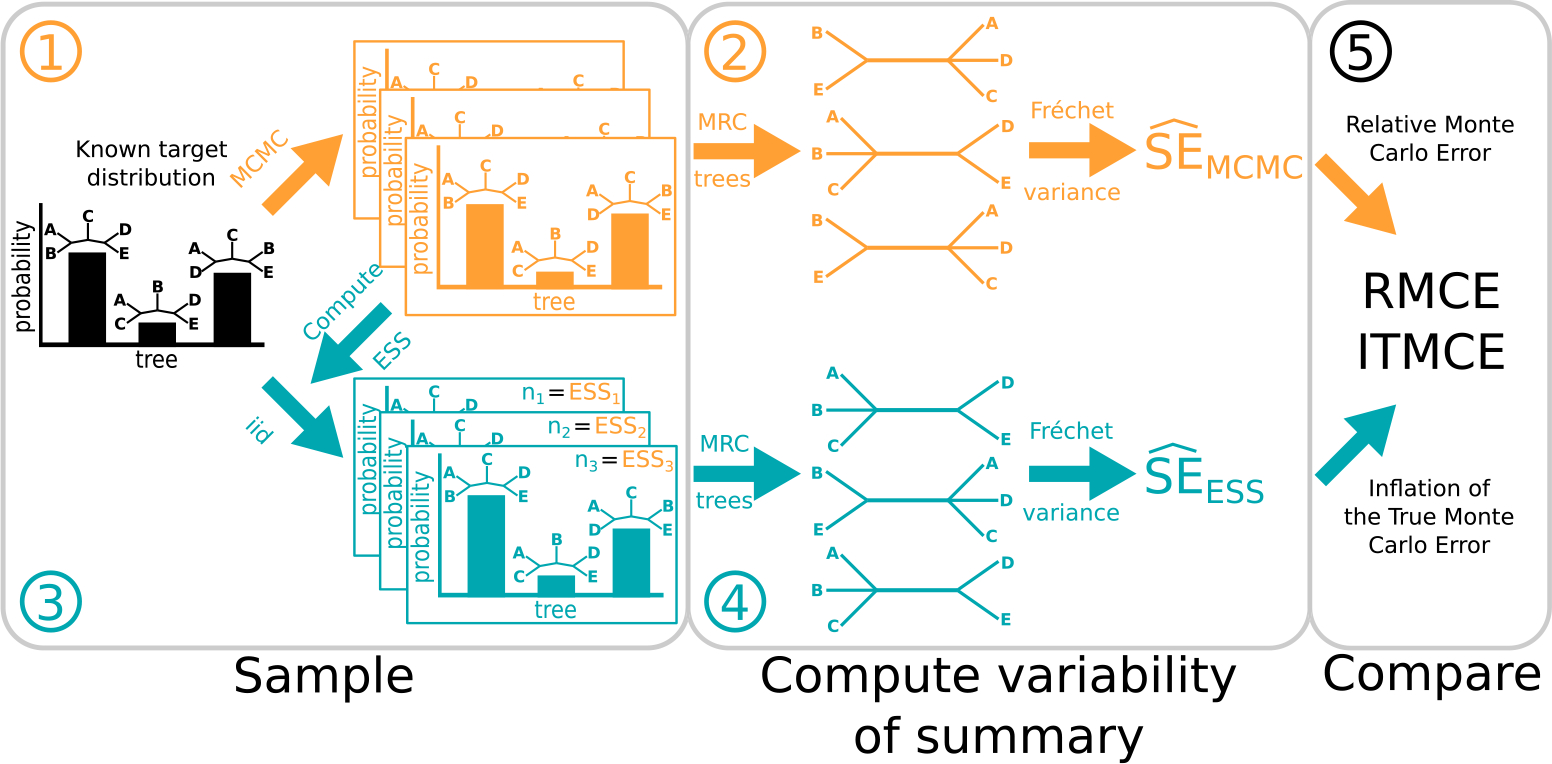
Figure 2:

A graphical depiction of steps 1–5 of our approach to testing tree ESS measures, highlighting the case where we examine the Fréchet standard error of the MRC tree. The general workflow is the same for the other cases, which calculate the standard error of split and tree probabilities. Steps involving MCMC are shown on top in orange, while steps involving iid samples are shown on bottom in teal. We begin with a (known) target distribution. Before we can consider Monte Carlo errors, we must sample from this distribution. We do this first using an MCMC algorithm (Step 1), and then by simply drawing iid samples (Step 3). The key is that we draw iid samples according to the effective sample size of each of the MCMC chains from Step 1. Here we have MCMC chains, so we draw sets of ESS-equivalent samples. We must then summarize each of these sets of samples. In this paper, we consider three distinct summaries, as depicted in Figure 1. Here we show the MRC tree as the summary, yielding MRC trees from MCMC chains (Step 2, left) and MRC trees from the ESS-equivalent samples (Step 4, left). The variability of these summaries is a brute-force estimate of the Monte Carlo error. The Fréchet standard deviation of the MRC trees right). The Fréchet standard deviation of the MRC trees from the ESS-equivalent iid samples gives us the (Step 4, right). (For split and tree probabilities, the and are the usual standard error rather than a Fréchet standard error.) If an ESS measure works, then it is informative about the number of independent samples which would have the same Monte Carlo error as a given set of MCMC samples. Thus, we should expect the and to be similar, and the last step is to compare them. We use the RMCE and ITMCE, which are measures of relative difference.
