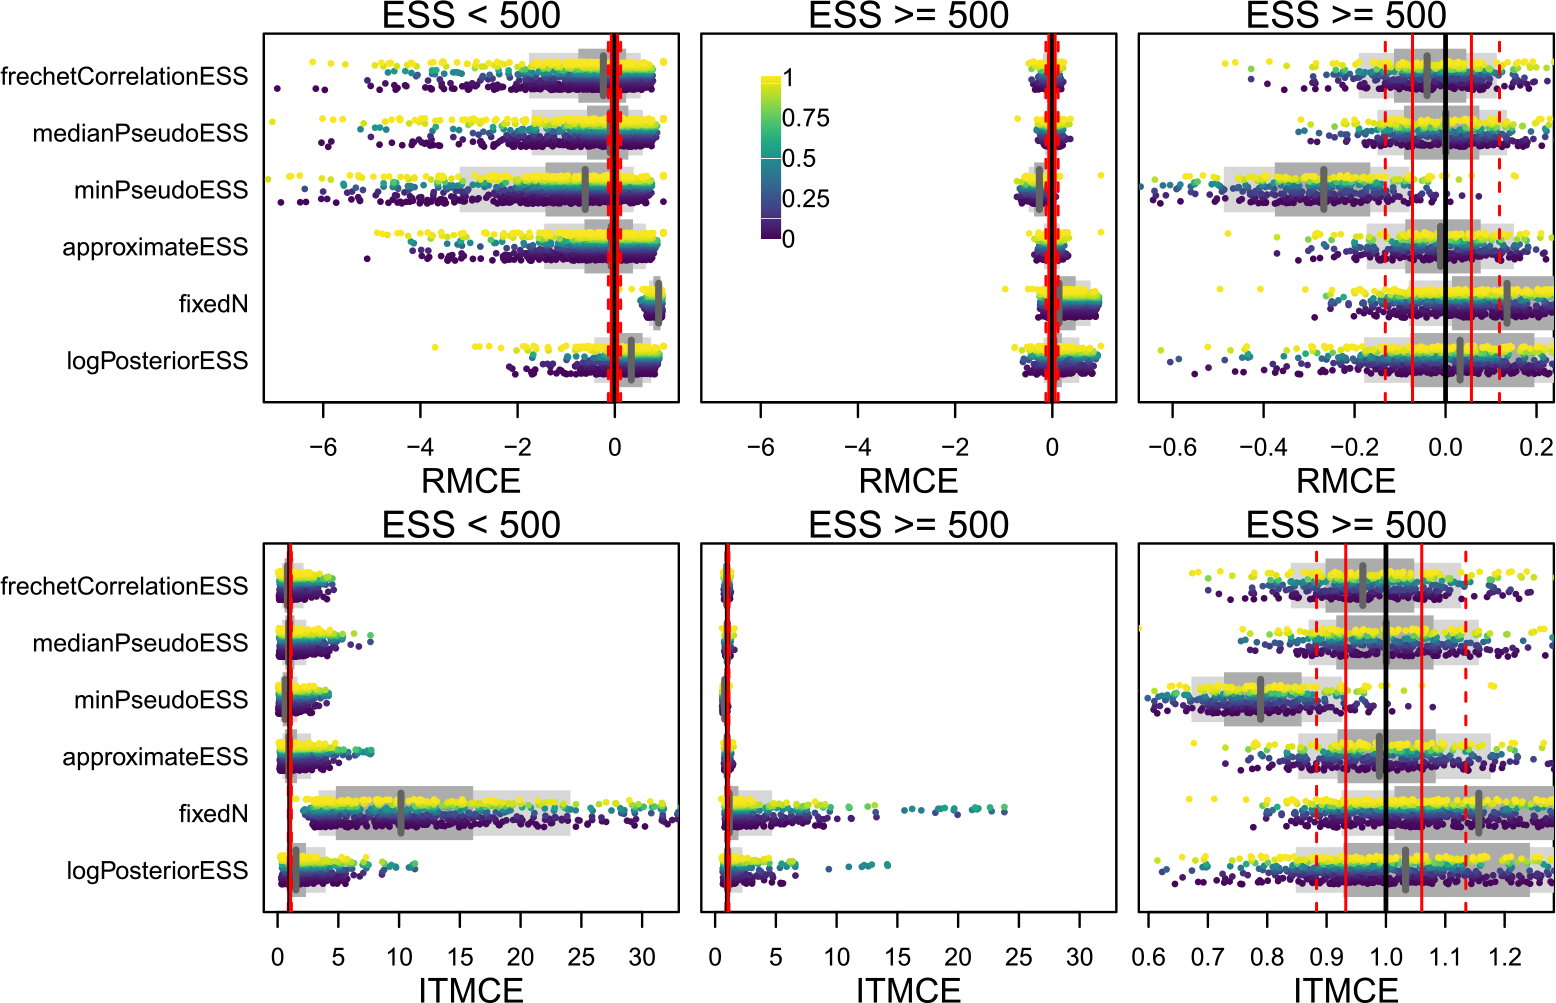
Figure 3:

The RMCE and ITMCE for split probabilities for all topological ESS measures and all 45 combinations of 9 datasets and 5 run lengths. Each point is the RMCE or ITMCE for a single split from one of the 45 simulations, colored by their estimated probabilities (see scale bar in top middle panel). Only splits with a posterior probability of at least 0.01 are shown. The two right panels are the same except for the scale of the x-axis. Whether a simulation appears in the left or right panels is determined by the estimated average ESS of each of the 45 simulations (the “ESS” in the column label), such that all splits from a simulation with average frechetCorrelationESS of 100 would appear in the left panel, while all splits from a simulation with an average Fréchet correlation ESS of 600 would appear in the right two panels. As fixedN always assumes ESS = 1000, for this row we split by the number of MCMC iterations run, with the left panel including 103 and 104, and the right panel 105, 106, and 107. The thinner light grey bar below the points shows the 80% quantile range, the thicker dark grey bar the 50% quantile range, and the vertical grey line is the median. Ideal performance is and (perfect estimation of the Monte Carlo SE). As references we have plotted a solid black line for perfect performance, while the dashed (solid) red lines represent the 80% quantile range (50% quantile range) from the univariate Normal(0, 1) experiment. The best performance that might reasonably be expected of a tree ESS measure would match the Normal(0, 1) experiment, and thus have the grey line on the solid black line, the thinner light grey bar align with the dashed red lines, and the thicker dark grey bar align with the solid red lines. implies underestimating the ESS, while implies overestimating the ESS. The log-posterior ESS and assuming tend to overestimate the ESS for splits, often substantially, while most tree ESS measures are much closer to the truth.
