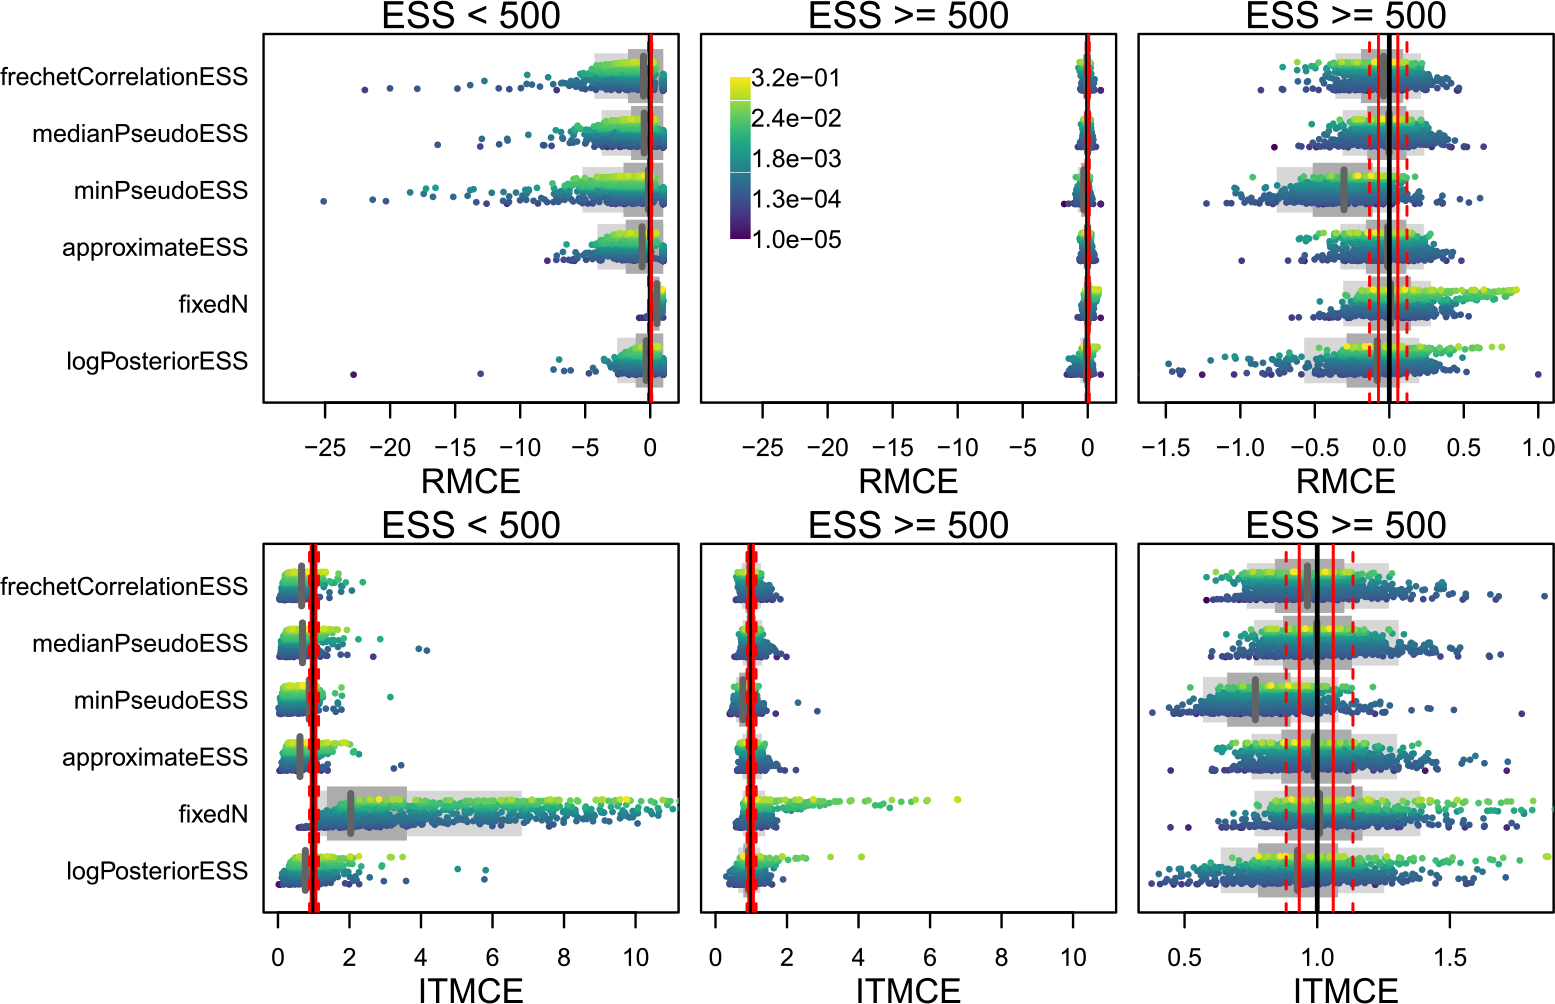
Figure 4:

The RMCE and ITMCE for topology probabilities for all topological ESS measures and all 45 dataset by run length combinations. Each point is the RMCE or ITMCE for a single tree topology from one of the 45 simulations, colored by their estimated probabilities (see scale bar in top middle panel). As there are too many distinct topology probabilities (nearly 100,000 across all 45 simulations), we plot only 1000 per row, preferentially keeping the highest-probability trees as these are the ones that contribute most to summary trees. For more explanation, see Figure 3 caption.
