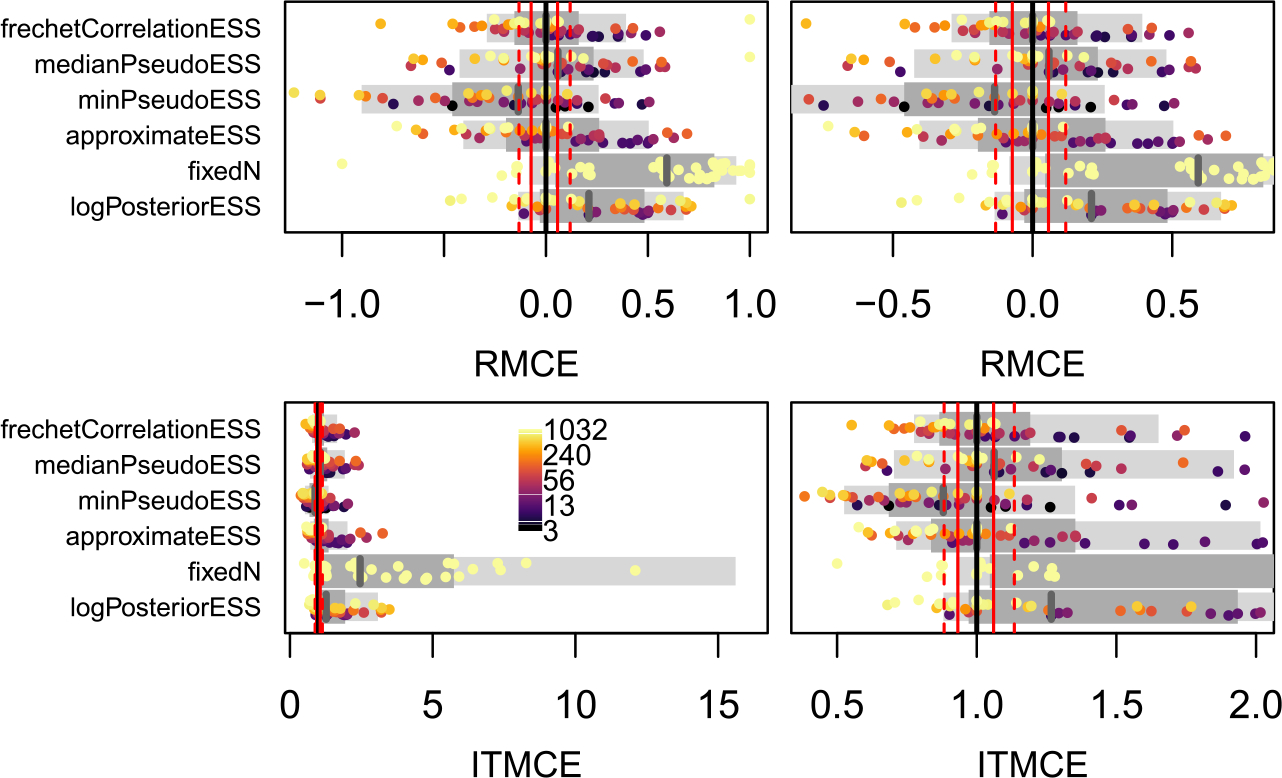
Figure 5:

The RMCE and ITMCE for the majority-rule consensus (MRC) tree for all topological ESS measures and all 45 dataset by run length combinations. Each point represents the RMCE or ITMCE for the summary tree from one of the 45 simulations. The standard error for the MRC tree is a Fréchet Monte Carlo SE, rather than a classical Euclidean Monte Carlo SE. The right and left panels are the same except for the scale of the x-axis. As there are only 45 MRC trees, points are colored by the estimated average ESS (see scale bar in bottom left panel), and all 45 are plotted together rather than separated according to an ESS threshold as in Figures 3 and 4. For more explanation, see Figure 3 caption.
