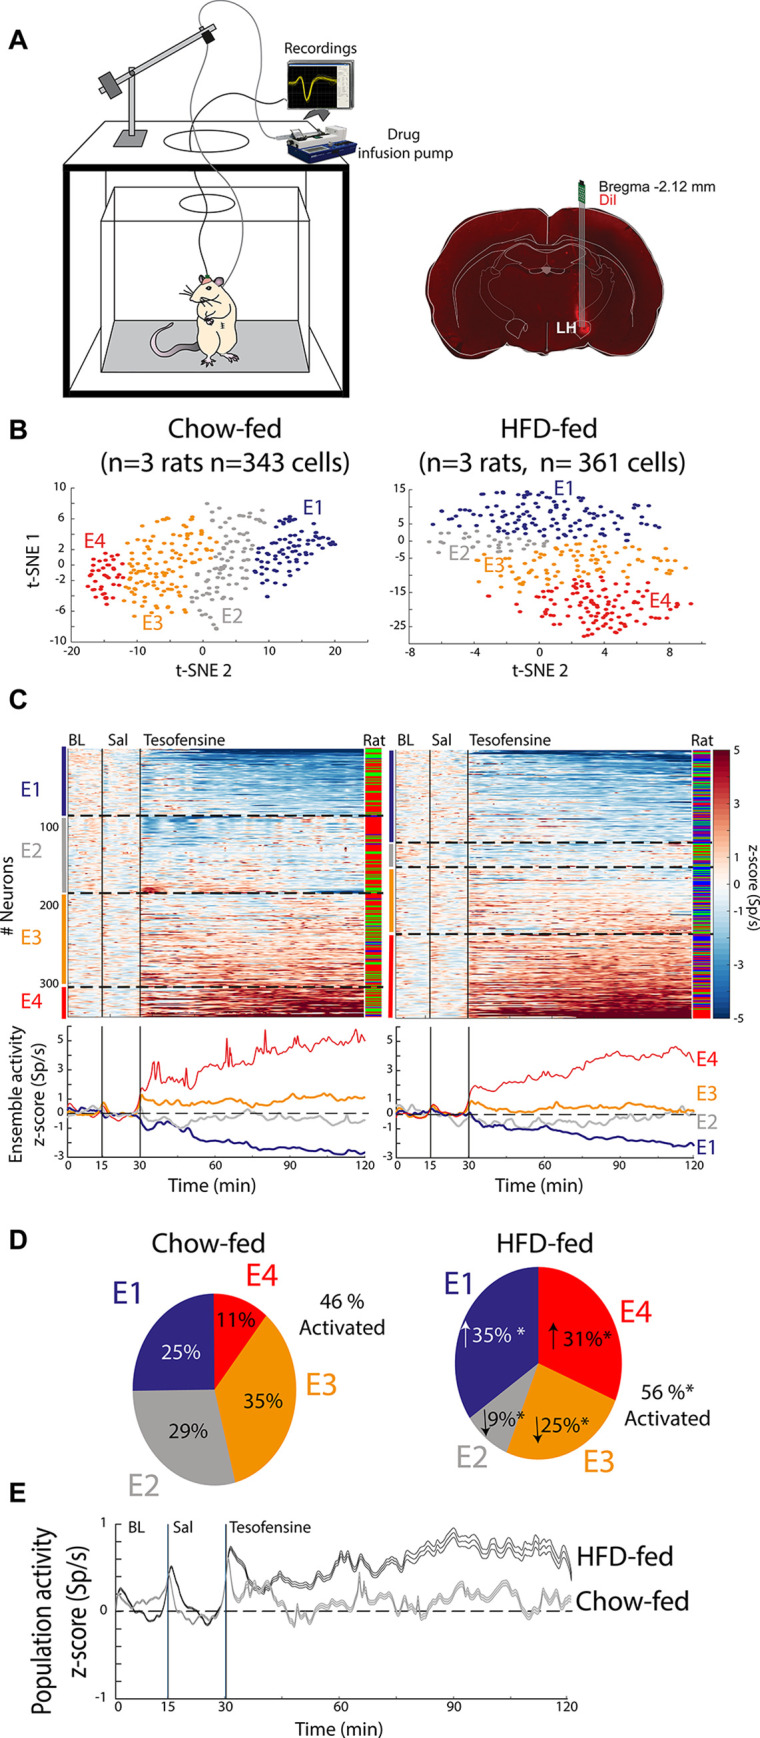
Fig 2. Tesofensine differentially modulates lateral hypothalamic neurons in lean and obese rats.

A. Left: A schematic representation for extracellular recording in a freely moving rat and pump for automatic drug delivery. No food was available during recordings. Right: histology, identifying recording sites in LH using a coronal section. Dil, a fluorescent and lipophilic red dye, is used to mark the tip of the electrode track. B. t-SNE and hierarchical cluster analysis of firing rates were used to group neurons with similar activity patterns into neuronal ensembles. This analysis uncovered four ensembles responding to tesofensine. Neurons were assigned into four ensembles (E1-4) for Chow-fed rats (left) and four ensembles for HFD-fed rats (right). Each dot represents a single neuron and the color of the ensemble to which it belongs in the t-SNE map. C. All neurons recorded were categorized into four ensembles (E1-E4) for Chow-fed rats (left) and HFD-fed rats (right). The normalized color-coded activity of each neuron over time is presented for chow-fed and HFD-fed rats, with red and blue indicating higher and lower z-score activity, respectively. Black vertical lines show the baseline (BL from 0–15 minutes), saline (Sal 15–30 minutes), tesofensine administered at 30 minutes and recordings that lasted up to 120 minutes. In three HFD rats, we recorded n = 127, 95, and 139 neurons, whereas in the other three Chow-fed rats, n = 220, 106, and 17 neurons. The color bar on the right indicates the rat in which the neuron was recorded. Peri-Stimulus Time Histograms (PSTHs) below demonstrate the average neuronal ensemble activity, with dashed lines dividing each cluster (ensemble). D. Pie charts depict the percentage of neurons in each ensemble for Chow-fed and HFD-fed rats. Chi-square analysis showed a significant difference compared to the same ensemble in Chow-fed rats (* p<0.05). E. The z-score normalized population activity of all lateral hypothalamic neurons recorded in HFD-fed (n = 361) and chow-fed rats (n = 343) is presented. The shadow represents the SEM.
