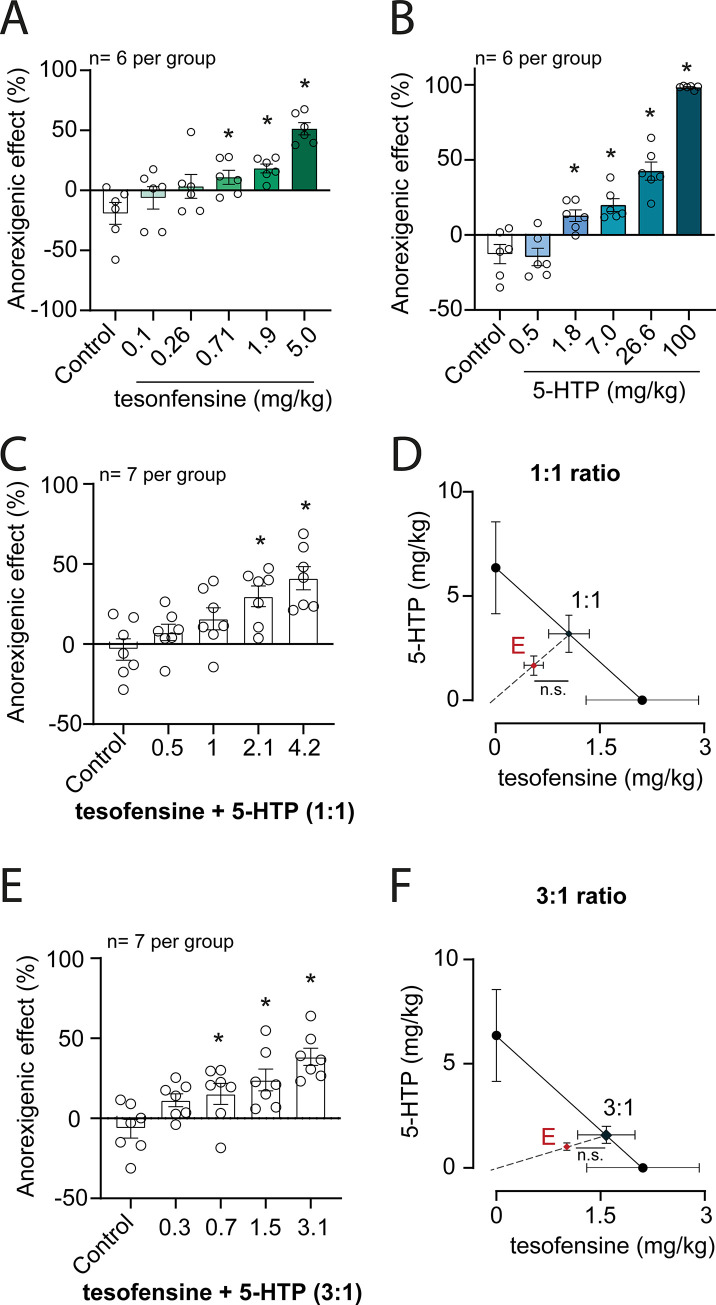
Fig 9. Isobolographic analysis of the interaction between tesofensine and 5-HTP/CB in a sucrose intake assay in rats.
The anorexigenic effect was measured as a reduction in sucrose intake (see text for details). Panels A-B depict the dose-dependent effect of tesofensine and 5-HTP/CB, respectively. Data are plotted as mean + SEM, open circles represent individual animals, and * corresponds to a statistically significant difference (p<0.05) with respect to the control group, as determined by one-way ANOVA. C. Depicts the dose-dependent effect of the 1:1 combination of tesofensine and 5-HTP/CB. Data are presented as for panels A and B. D. shows the isobolographic analysis of the 1:1 combination. The oblique line is the isobole corresponding to a purely additive interaction, and black circles represent the ED30 (+ SEM) values of the individual components and the theoretical ED30 value for a purely additive interaction. The red triangle indicates the experimental ED30 of the combination. A comparison of the theoretical and experimental ED30 was performed by the modified Student’s t-test, n.s. indicating a lack of statistically significant difference (p>0.05). E. depicts the dose-dependent effect of 3:1 combination of tesofensine and 5-HTP/CB. Data are presented as for panels A, B, and C. F. shows the isobolographic analysis of the 3:1 combination. Data are presented as in panel D.

