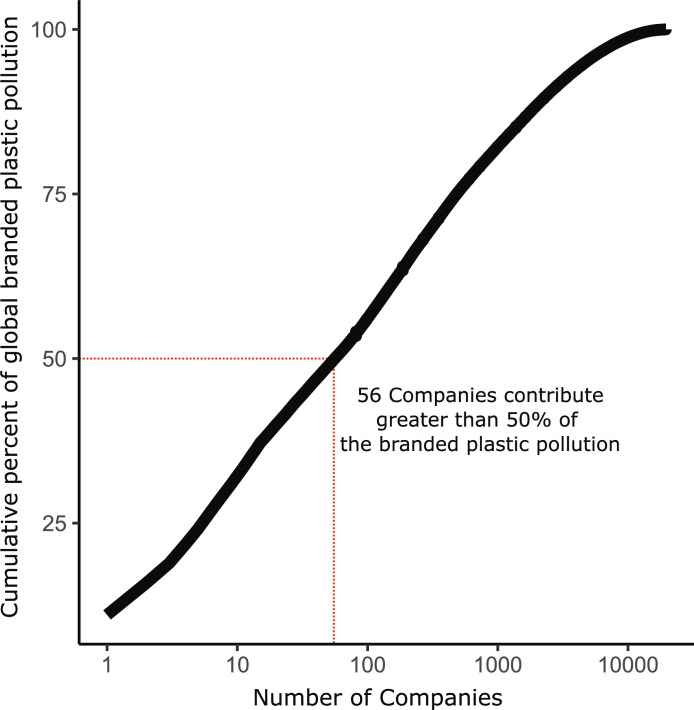
Fig. 4. Cumulative percent (%) (y axis) of total branded plastic count found during 1494 audit events by the number of companies (count) (x axis) responsible for the corresponding cumulative percent.
The x axis is log10 scaled, while the y axis is unscaled. The plot shows a log10 linear increase in the number of companies involved in pollution with a greater cumulative contribution.

