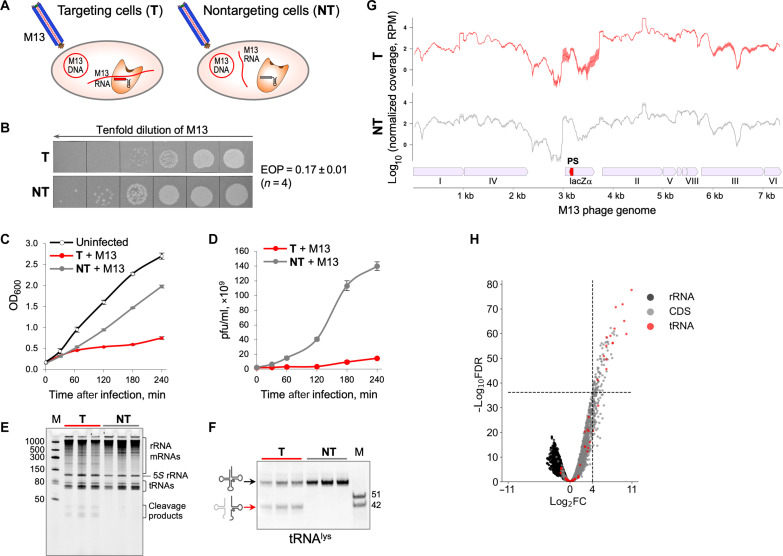
Fig. 4. Targeting of a nonessential M13 phage transcript induces tRNA cleavage in infected cells and prevents the infection spread.
(A) Schematic of targeting by LshCas13a of M13 phage transcript in E. coli. Targeting cells (T) express crRNA with a spacer (shown in red) matching M13 RNA, and, in nontargeting control cells (NT), the crRNA spacer (shown in gray) does not match any RNA. (B) Plaque assay of 10-fold serial dilutions of M13 lysate spotted on lawns of targeting or nontargeting cells. The efficiency of plaquing (EOP) is presented as means ± SEM, n = 4. (C) Targeting (red curve) and nontargeting (gray curve) cells in liquid cultures were infected with M13 phage at OD600 = 0.2 and multiplicity of infection = 10, and growth rate was monitored along with uninfected control (means ± SEM, n = 3). (D) Phage titers [plaque-forming units (pfu)/ml] in infected cell cultures measured at indicated time points after infection (means ± SEM, n = 3). (E) Total RNA isolated from M13-infected cells at 30 min after infection was resolved by denaturing gel electrophoresis followed by SYBR Gold staining. RNA samples from three biological replicates of targeting and nontargeting cells are shown. (F) Northern blot quantification of tRNAlys cleavage. (G) RNA-seq data show similar patterns of normalized read coverage [reads per million (RPM)] mapped on M13 phage genome for RNA isolated from targeting and nontargeting M13-infected cells. Small red pentagon indicates the target protospacer site within the lacZα gene. Line and shaded error bar represent means ± SEM of three biological replicates. (H) Volcano plot depicting the results of the comparison of 5′-end counts per nucleotide position of each strand between targeting and nontargeting samples of M13-infected cells. The analysis was performed in the same way as for Fig. 2H.

