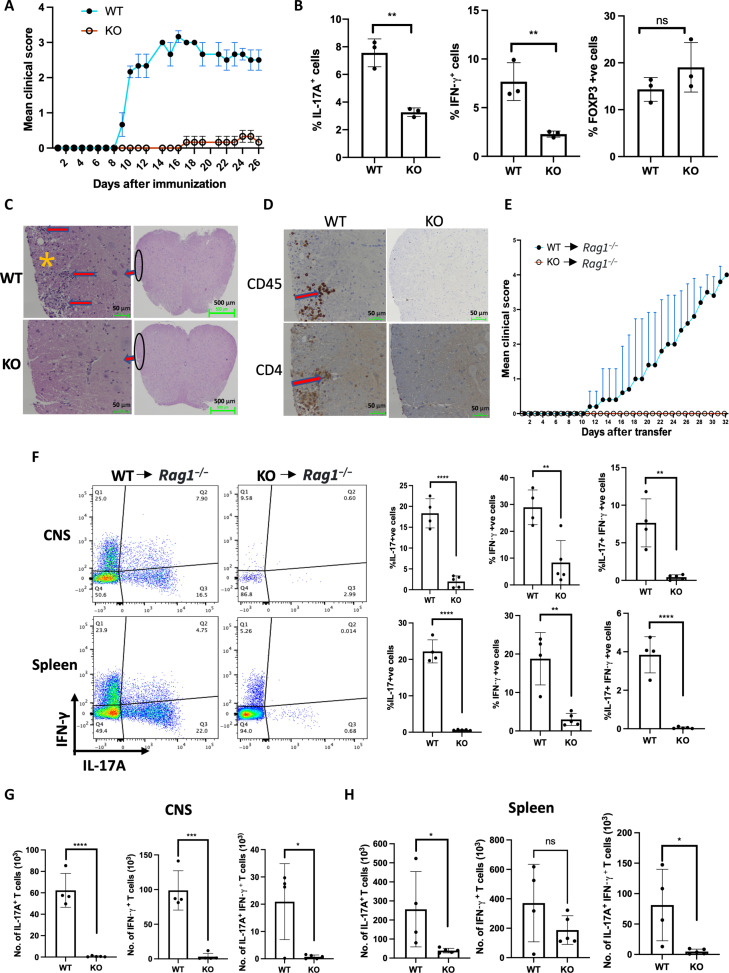
Fig. 2. SPTLC1 is required for TH17 differentiation in vivo.
(A) Mean clinical EAE scores of WT and KO mice immunized with MOG35–45 peptide. n = 3 mice per experimental group, representative of two independent experiments. (B) Frequency of IL-17A+, IFN-γ+, and FOXP3-positive cells in splenocytes of immunized mice at day 28. n = 3 biologically independent samples. (C) Representative hematoxylin and eosin staining of spinal cord sections obtained from indicated immunized mice at day 28. Red arrows and asterisks indicate infiltrated inflammatory cells and demyelinated foci, respectively. Scale bars, 50 μm (left) and 500 μm (right). n = 3 biologically independent samples. (D) Immunohistochemical staining for CD4+ and CD45+ cells in spinal cord sections from immunized WT and KO mice at day 28. The red arrow indicates positive cells. Scale bar, 50 μm. n = 3 biologically independent samples. (E) Mean clinical scores for EAE in RAG−/− mice transferred with equal number of ex vivo differentiated CD4+ T cells from MOG35–45 immunized WT and KO mice. RAG−/− mice receiving WT cells (n = 4); RAG−/− mice receiving KO cells (n = 5). (F to H) CNS and spleen were isolated from the RAG−/− mice receiving WT cells at the peak of the disease and from corresponding RAG−/− mice receiving KO cells and scored for frequency (F) and absolute number (G and H) of IL-17A+, IFN-γ+, and IL-17A+IFN-γ+ DP cells by flow cytometry. (F) The left panel is a representative flow figure, and the right panel shows the cumulative data of the same. The top panel is from CNS and the bottom panel is from spleen. (G and H) CNS (G) and spleen (H). RAG−/− mice receiving WT cells (n = 4); RAG−/− mice receiving KO cells (n = 5). Each dot represents an individual mouse. All data presented as means ± SEM: *P < 0.05; **P < 0.01; ***P < 0.001; ****P < 0.0001; ns, not significant.

