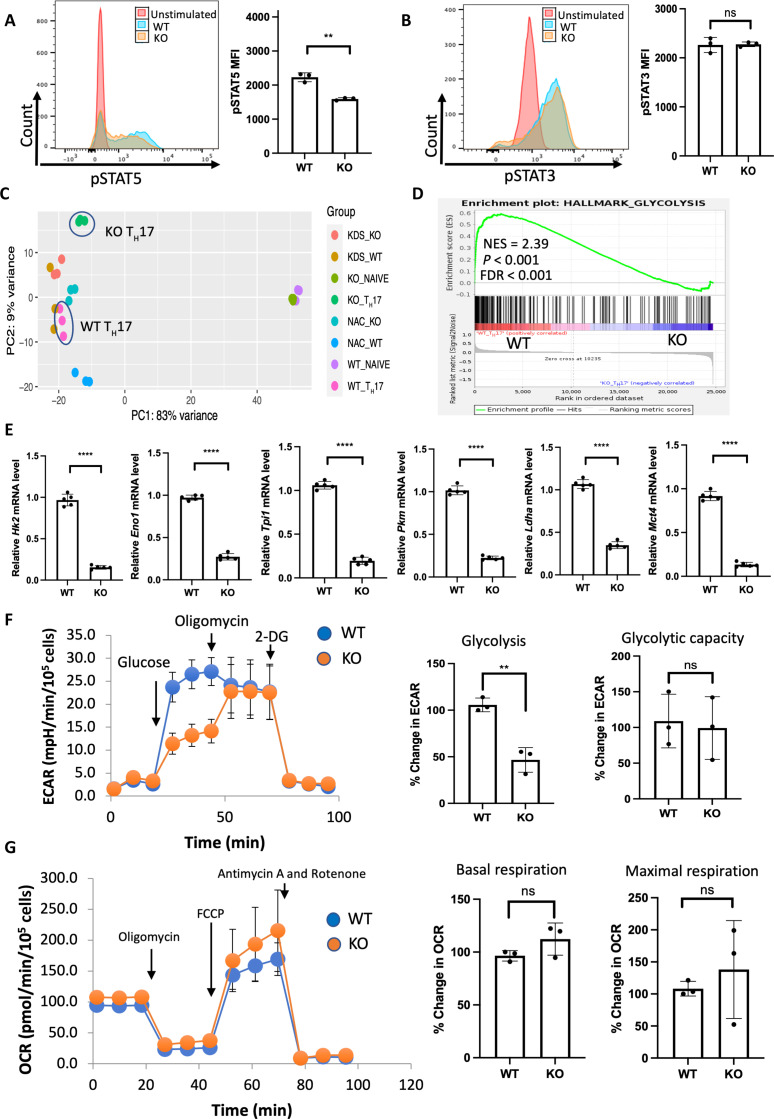
Fig. 3. SPTLC1 is required for metabolic reprograming in TH17 cells.
(A) WT and KO naïve cells were differentiated under TH17 conditions for 12 hours and scored for phosphorylated STAT5 by flow cytometry. The left panel is a representative flow figure, and the right panel shows the cumulative data of the pSTAT5 MFI. n = 3 biologically independent samples. (B) WT and KO naïve cells were differentiated under TH17 conditions for 12 hours and scored for phosphorylated STAT3 by flow cytometry. The left panel is a representative flow figure, and the right panel shows the cumulative data of the pSTAT3 MFI. n = 3 biologically independent samples. (C) Principal components analysis (PCA) of WT and KO TH17 cell RNA-seq data. n = 3 biological replicates per group. (D) GSEA result of HALLMARK_GLYCOLYSIS gene sets between WT and KO TH17 cells. (E) qPCR analysis of indicated glycolytic genes in WT and KO TH17 cells (naïve CD4+ T cells cultured under TH17 conditions for 3 days). n = 5 biologically independent samples. (F) WT and KO naïve T cells were differentiated under TH17 conditions for 3 days and ECAR measured in equal number of viable cells by Seahorse analyzer. The left panel shows the representative data, and the right panel shows the percentage change in ECAR for glycolysis and glycolytic capacity. n = 3 biologically independent samples. (G) TH17 cells were differentiated as in (F) and OCR measured in equal number of viable cells by Seahorse analyzer. The left panel shows the representative data, and the right panel shows the cumulative data for basal and maximal respiration. n = 3 biologically independent samples. Each dot represents an individual mouse. All data presented as means ± SEM: **P < 0.01; ****P < 0.0001; ns, not significant.

