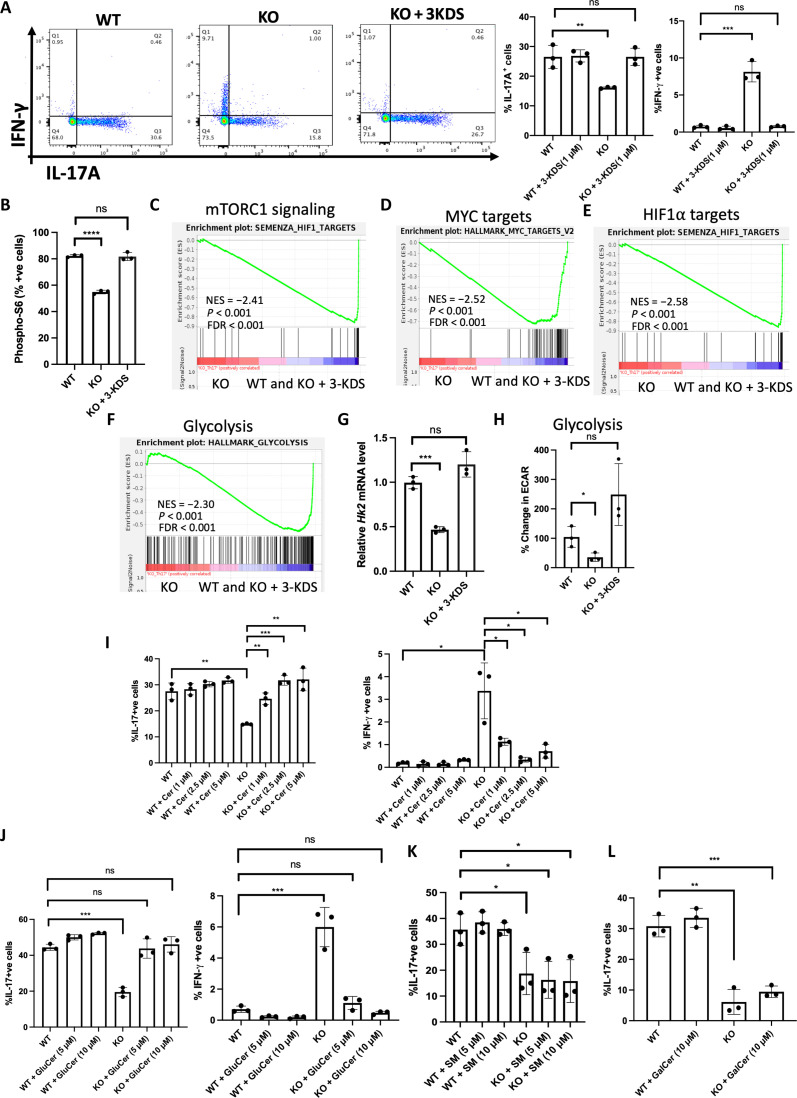
Fig. 5. SPT enzyme product 3-KDS rescues the defects in SPTLC1-deficient TH17 cells.
(A) WT and KO naïve cells were differentiated under TH17 conditions with or without 3-KDS (1 μM) for 4 days and scored for frequency of IL-17A+ and IFN-γ+ cells by flow cytometry. The left panel is a representative flow figure, and the right panel shows the cumulative data of the same. n = 3 biologically independent samples. (B) WT and KO naïve cells were differentiated under TH17 conditions for 12 hours with or without 3-KDS and scored for frequency of phospho-S6+ cells by flow cytometry. n = 3 biologically independent samples. (C to F) GSEA for (C) mTOR signaling genes, (D) c-Myc target genes, (E) HIF-1α target genes, and (F) glycolytic genes between KO and (WT and KO + 3-KDS) TH17 cells. (G) WT and KO naïve cells were differentiated under TH17 conditions with or without 3-KDS (1 μM) for 3 days and Hk2 mRNA quantified by qPCR. n = 3 biologically independent samples. (H) WT and KO naïve T cells were differentiated under TH17 conditions with or without 3-KDS for 3 days and ECAR measured in equal number of viable cells by Seahorse analyzer. n = 3 biologically independent samples. (I to L) WT and KO naïve cells were differentiated under TH17 conditions for 4 days with or without indicated concentrations of (I) C6 ceramide (Cer), (J) glucosylceramide (GluCer), (K) sphingomyelin (SM) (L), and galactosylceramide (GalCer), and reactivated with phorbol 12-myristate 13-acetate/ionomycin for 6 hours and scored for frequency of IL-17A+ and IFN-γ+ cells by flow cytometry. (I and J) Left: %IL-17A+ cells; right: % IFN-γ+ cells. n = 3 biologically independent samples. Each dot represents an individual mouse. All data presented as means ± SEM: *P < 0.05; **P < 0.01; ***P < 0.001; ****P < 0.0001; ns, not significant.

