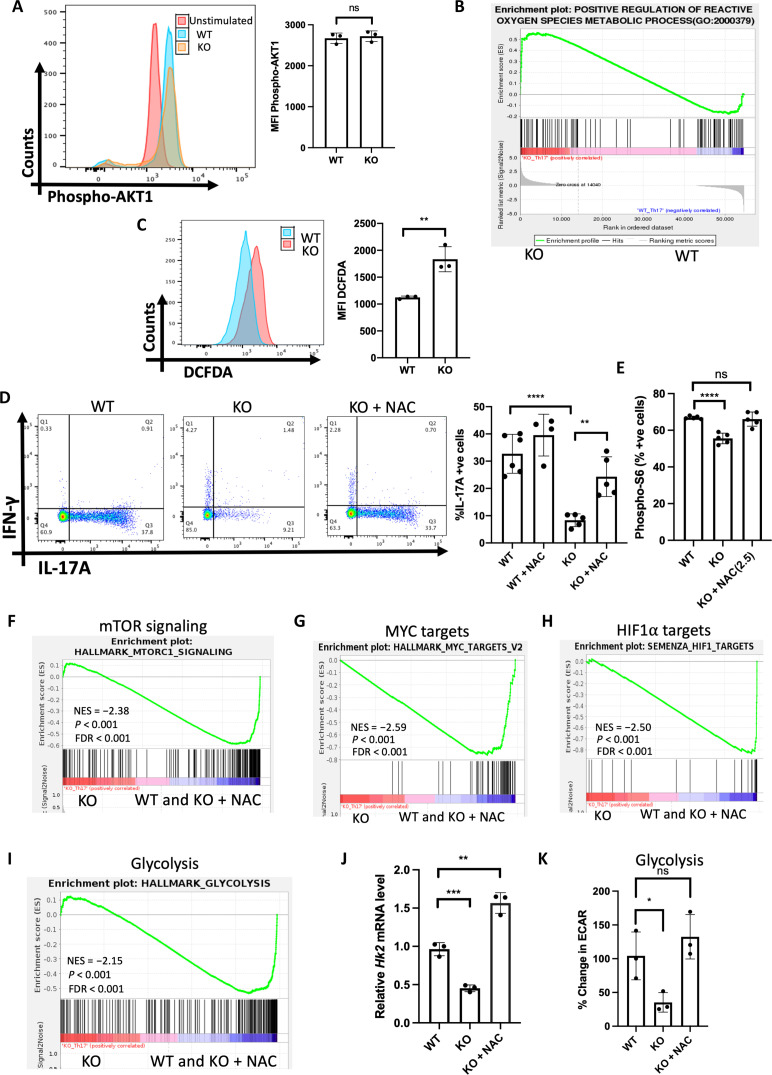
Fig. 6. SPTLC1 deficiency impairs TH17 differentiation by increasing intracellular ROS.
(A) WT and KO naïve cells were differentiated under TH17 conditions for 12 hours and scored for phospho-Akt(S473) by flow cytometry. The left panel is a representative flow figure, and the right panel shows cumulative p-Akt MFI. n = 3 biologically independent samples. (B) GSEA for positive regulation of ROS genes between WT and KO TH17 cells. (C) WT and KO naïve cells were differentiated under TH17 conditions for 12 hours and intracellular ROS measured using DCFDA by flow cytometry. The left panel is a representative flow figure, and the right panel shows the cumulative data of DCFDA MFI. n = 3 biologically independent samples. (D) WT and KO naïve cells were differentiated under TH17 conditions for 4 days with or without NAC and scored for intracellular cytokine. The left panel is a representative flow figure, and the right panel shows the cumulative data of the same. n = 4 to 6 biologically independent samples. (E) WT and KO naïve cells were differentiated under TH17 conditions with or without NAC for 12 hours and scored for frequency of phospho-S6+ cells by flow cytometry. n = 5 biologically independent samples. (F to I) GSEA for (F) mTOR signaling genes, (G) c-Myc target genes, (H) HIF-1α target genes, and (I) glycolytic genes KO and (WT and KO + NAC) TH17 cells. n = 3 biologically independent samples. (J) Hk2 mRNA quantification by qPCR of TH17 under the indicated differentiation conditions. n = 3 biologically independent samples. (K) WT and KO naïve T cells were differentiated under TH17 conditions with or without NAC for 3 days and ECAR was measured in equal number of viable cells by Seahorse analyzer. n = 3 biologically independent samples. Each dot represents an individual mouse. All data presented as means ± SEM: *P < 0.05; **P < 0.01; ***P < 0.001; ****P < 0.0001; ns, not significant.

