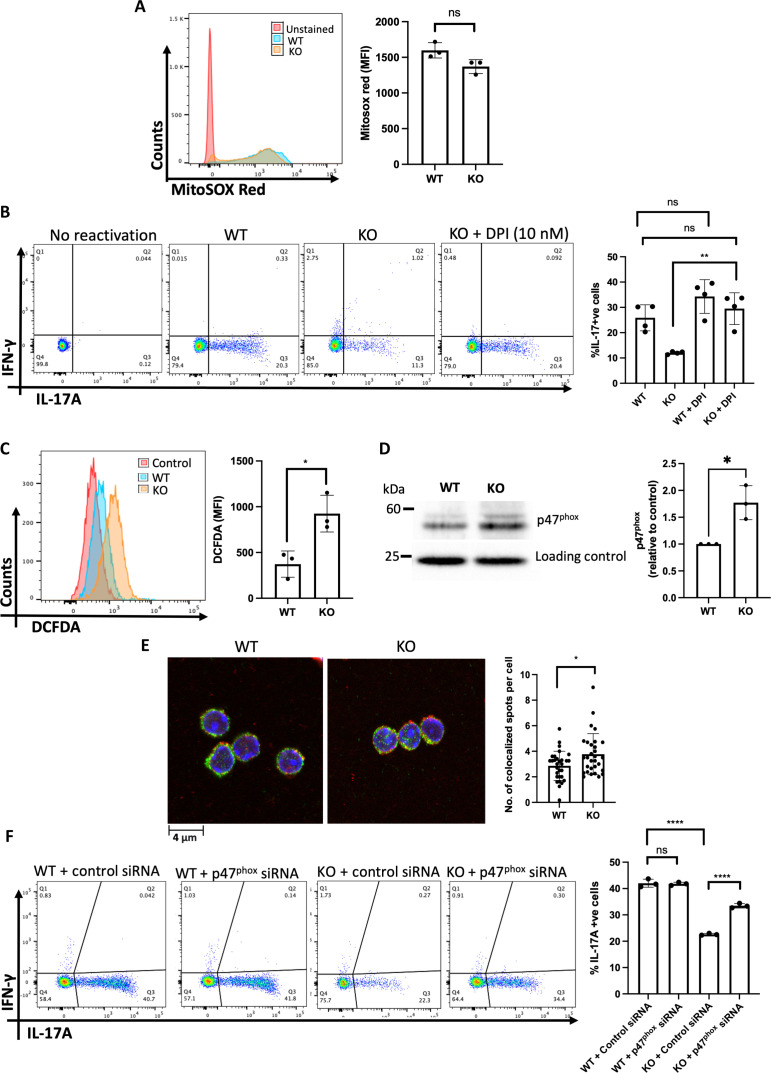
Fig. 7. SPTLC1 deficiency increases intracellular ROS by enhancing NOX activity.
(A) WT and KO naïve CD4+ T cells were differentiated under TH17 conditions for 12 hours and mitochondrial ROS measured using Mitosox red. The left panel is a representative histogram, and the right panel shows the cumulative data (MFI) from n = 3 biologically independent samples. (B) WT and KO naïve CD4+ T cells were differentiated under TH17 conditions for 4 days with or without DPI (10 nM) and scored for intracellular cytokines. The left panel is a representative flow figure, and the right panel shows the cumulative data from n = 4 biologically independent samples. (C) WT and KO naïve CD4+ T cells cross-linked with anti-CD3 for 15 min with DCFDA and read in flow cytometry. The left panel is a representative histogram, and the right panel shows the cumulative data (MFI) from n = 3 biologically independent samples. (D) WT and KO naïve CD4+ T cells cross-linked as in (C) and membrane fraction immunoblotted for p47 phox. Each lane is a pooled sample from four to eight mice. The left panel shows representative blot, and the right panel is the quantitative data from three independent experiments. (E) CD4+ T cells cross-linked as in (C) and stained for gp91phox (green) and p47 phox (red) and analyzed using confocal microscopy. The left panel shows the representative confocal picture, and the right panel shows the number of colocalization spots per cell. n = 3 biologically independent samples. (F) WT and KO Naïve CD4+ T cells were nucleofected with control or p47phox siRNA, differentiated into TH17 cells, and scored for intracellular cytokines. The left panel is a representative flow figure, and the right panel shows the cumulative data. Each dot represents cells pooled from three mice. n = 3 independent experiment. All data presented as means ± SEM: *P < 0.05; **P < 0.01; ****P < 0.0001; ns, not significant.

