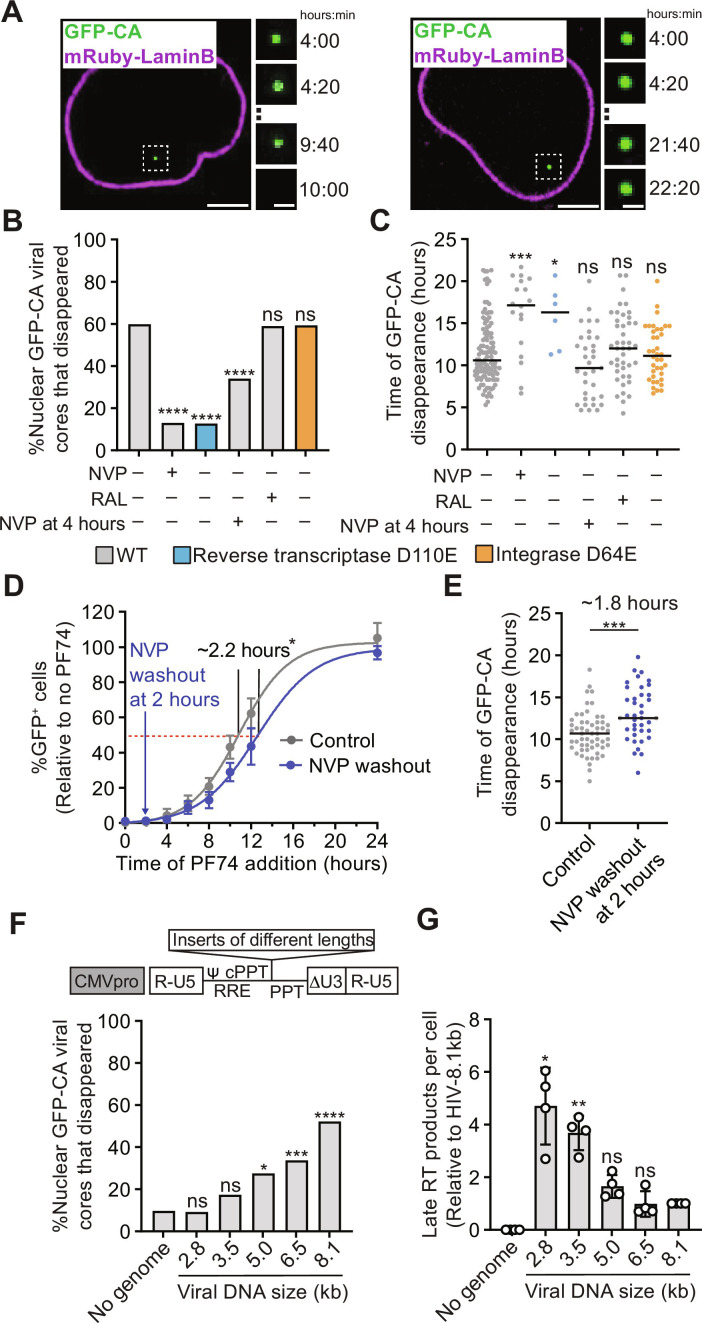
Fig. 1. Effect of reverse transcription, integration, and genome size on uncoating of nuclear HIV-1 cores.
(A) Live-cell imaging of aphidicolin-treated HeLa cells expressing mRuby-LaminB infected with GFP-CA–labeled HIV-1. Examples of GFP-CA disappearance in the nucleus (left) or remaining in the nucleus until the end of a movie (right). Scale bars, 10 μm (large) and 2 μm (small). (B) Percentage of nuclear HIV-1 cores that disappeared during the movies for the indicated virus and cell treatments. All vector genomes are 10.3 kb. (C) Time (hours) after infection of GFP-CA disappearance. (D) PF74 time-of-addition experiment in untreated cells (control) or in cells treated with NVP at time of infection followed by washout 2 hours later. The percentage of GFP reporter–expressing cells was determined ~1 day after infection and is shown relative to untreated control cells (set to 100%; means ± SD, n = 6 biological replicates). (E) Time (hours) after infection of GFP-CA disappearance in untreated control cells or in cells treated with NVP at time of infection followed by washout 2 hours later. (F) Top: Schematic of different-sized lentiviral vectors by addition of non–HIV-1 sequence (see "Synthesis of long dsDNA reverse transcription products is required for efficient uncoating"). Bottom: Percentage of nuclear HIV-1 cores containing no viral RNA genome or different-sized genomes that disappeared during the movies. Expected size (kilobase) of genome after reverse transcription is indicated for each vector. cPPT, central polypurine tract; PPT, polypurine tract; RRE, rev-response element. (G) Late RT products for indicated viruses 6 hours after infection of aphidicolin-treated HeLa cells with p24-normalized virus input (means ± SD, Welch’s t test, n = 4 biological replicates). For (B), (E), and (F), the number of HIV-1 cores analyzed for each sample ranged from 51 to 187 (average = ~94). Fisher’s exact test. For (C) and (E), lines = median; Mann-Whitney U test. *P < 0.05, **P < 0.01, ***P < 0.001, and ****P < 0.0001; ns, not significant.

