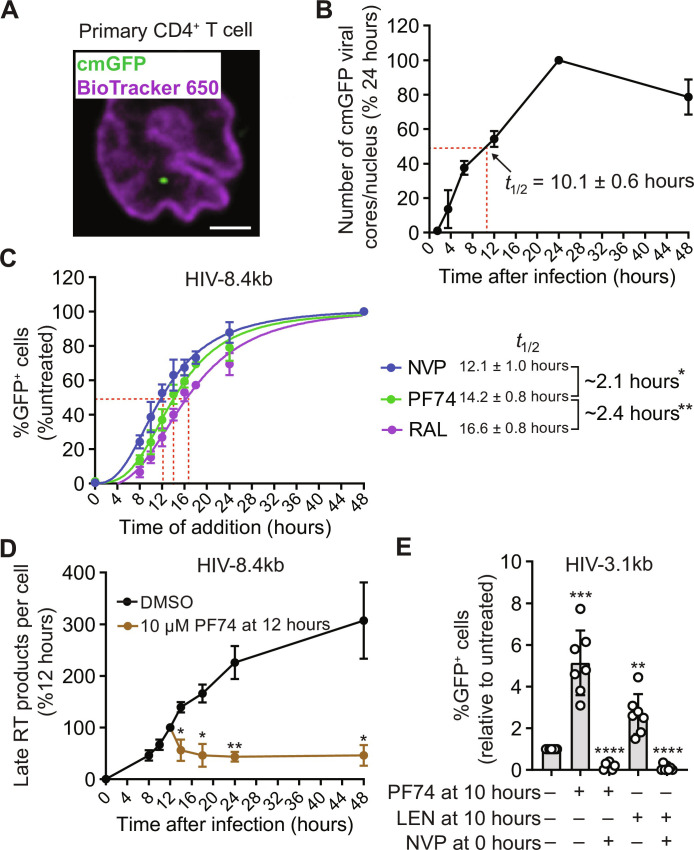
Fig. 4. Kinetics of nuclear import, reverse transcription, uncoating, and integration in primary activated CD4+ T cells, and effect of CA inhibitor-induced disruption of HIV-1 cores on viral DNA levels and expression of GFP reporter.
(A) HIV-1 core labeled with content marker GFP (cmGFP) in the nucleus of a primary activated CD4+ T cell 12 hours after infection; nucleus stained using BioTracker 650 Dye. Scale bar, 2 μm. (B) Number of nuclear cmGFP-labeled HIV-1 cores per cell at the indicated time points (means ± SD, n = 3 biological replicates, two donors). An average of 2.6 nuclear HIV-1 cores per cell was detected 24 hours after infection (set to 100%). (C) Percentage of GFP-expressing cells measured 48 hours after infection after addition of NVP, PF74, and RAL at different time points (means ± SD, n = 4 biological replicates, four donors). (D) Quantitation of late RT products at different times after infection with HIV-8.4kb (means ± SD, Welch’s t test, n = 4 biological replicates, four donors). An average of 0.4 late RT products per cell was detected 12 hours after infection (set to 100%). (E) Fold change in the percentage of GFP reporter–expressing cells measured 1 day after infection with HIV-3.1kb; data shown relative to untreated control (set to 1; means ± SD, Welch’s t test, n = 7 biological replicates). *P < 0.05, **P < 0.01, ***P < 0.001, and ****P < 0.0001.

