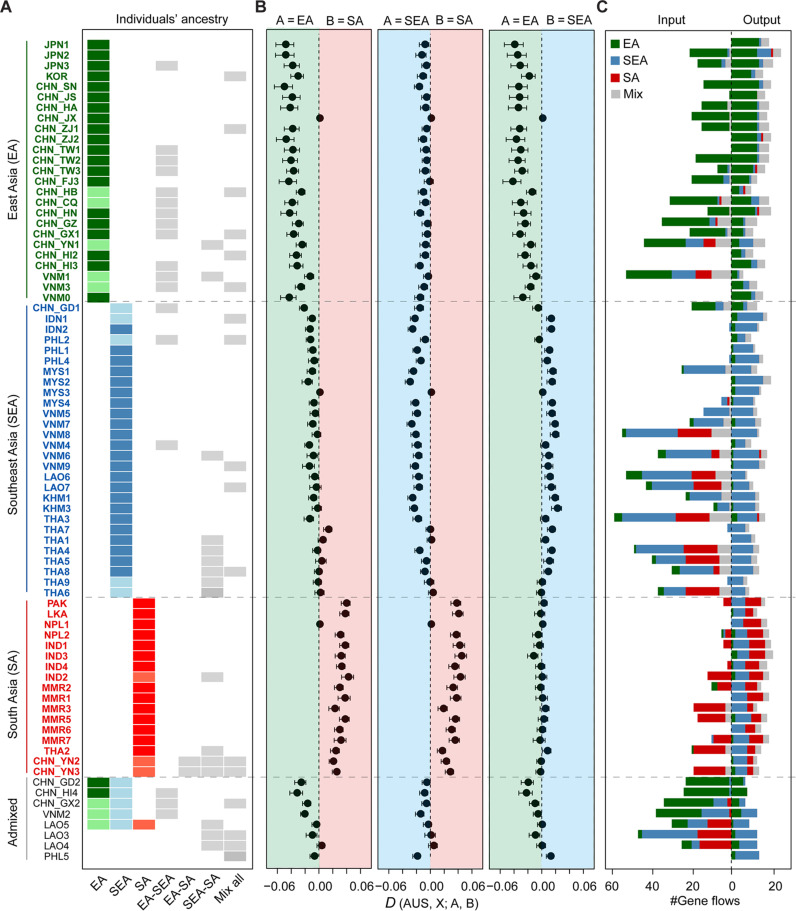
Fig. 2. Genetic sources of and gene flows worldwide BPHs.
(A) Genetic sources of each geographic population along with its genetic relationship to one of the main genetic groups. The genetic sources of all sampled individuals of the focal population (names shown on the left of each row, and individuals included in each population were listed in data S1) are shown with colored cells, i.e., what main groups the sampled individuals of this population were genetically assigned to. Each individual was defined to a main genetic group or an admixed group based on the inferred ancestry component (see Materials and Methods). Admixed populations are displayed in gray cells. (B) D statistics are shown to support the genetic assignment results. D indicates the comparison between the affinity of each geographic population with one of the main groups A and that with B (names shown on the top). D < 0 supports the affinity of the target population with the main group A, while D > 0 supports that with group B. Australian populations were used as outgroup. (C) Bar plots illustrating the inferred gene flows on focal populations. Left: Gene flows from other populations of certain groups (in color) to the focal population. Right: Gene flows from the focal population to other populations.

