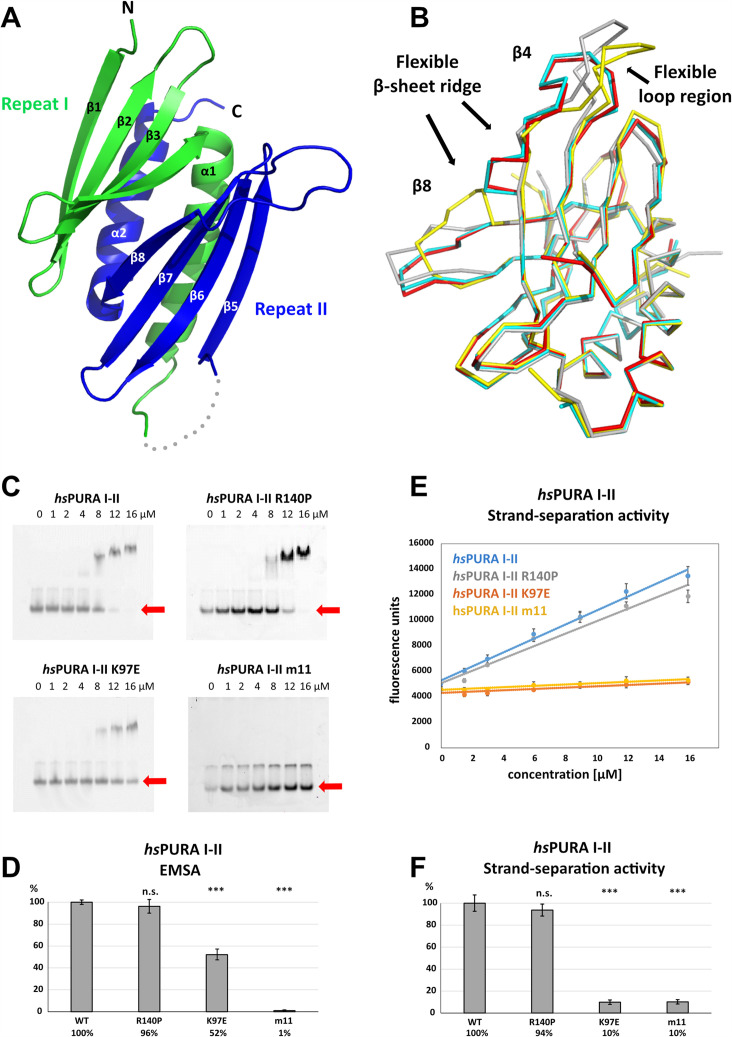
Figure 4. Structure and nucleic acids interaction of the N-terminal PUR domain.
(A) Crystal structure of wild-type hsPURA repeats I (green) and II (blue) at 1.95 Å resolution. Protein fragment for which no electron density was visible is shown as a gray dotted line. (B) Ribbon presentation of the overlay of all four chains (shown in different colors) of hsPURA I–II in the asymmetric unit of the crystal. There are three regions showing greater differences in folding between these individual molecules, indicating that they are flexible and likely adopt several conformations also in solution. (C) In electrophoretic mobility shift assays (EMSAs), the interaction of different hsPURA I–II variants with 24-mer RNA (CGG)8 labeled with Cy5-fluorophore was observed. The amount of labeled RNA was kept constant at 8 nM while the protein concentration increased from 0 to 16 μM. The unbound RNA was used for quantification (see D) and is indicated with the red arrow. Above the unbound RNA a second band of free RNA is visible, which might constitute a different conformation or RNA dimer. (D) Quantification of the RNA interactions of different hsPURA I–II variants from EMSAs shown in (C). The RNA-binding affinity of wild-type hsPURA was normalized to 100%. Pairwise t-test was used to assess differences in RNA binding compared to the hsPURA I–II. The variants K97E and m11 showed significantly lower relative affinities (p = 1.5E−05 and p = 4.6E−09, respectively). In contrast, the variant R140P did not alter binding affinity (p = 0.5). (E) Strand-separation activity of different hsPURA variants. For each hsPURA sample at least three measurements has been performed. The graphs show the averaged values as points as well as the standard deviations as error bars. The strand-separation activity shows linear increase within the used concentration range. (F) Quantitative representation of strand-separating activity of the hsPURA I–II variants. The strand-separating activity of hsPURA I–II was quantified from the slope in (E) and normalized to 100%. Except for R140P (p = 0.07), pairwise t-tests of the hsPURA I–II variants showed significantly lower relative activity (K97E p = 3.9E−16 and m11 p = 9.2E−16) than hsPURA I–II. For each experiment and each protein variant three replicates were measured, the standard deviations were calculated and are shown as bars. Asterisks in (D) and (F) indicate significance level: *** for p ≤ 0.001; n.s. for p > 0.05.


