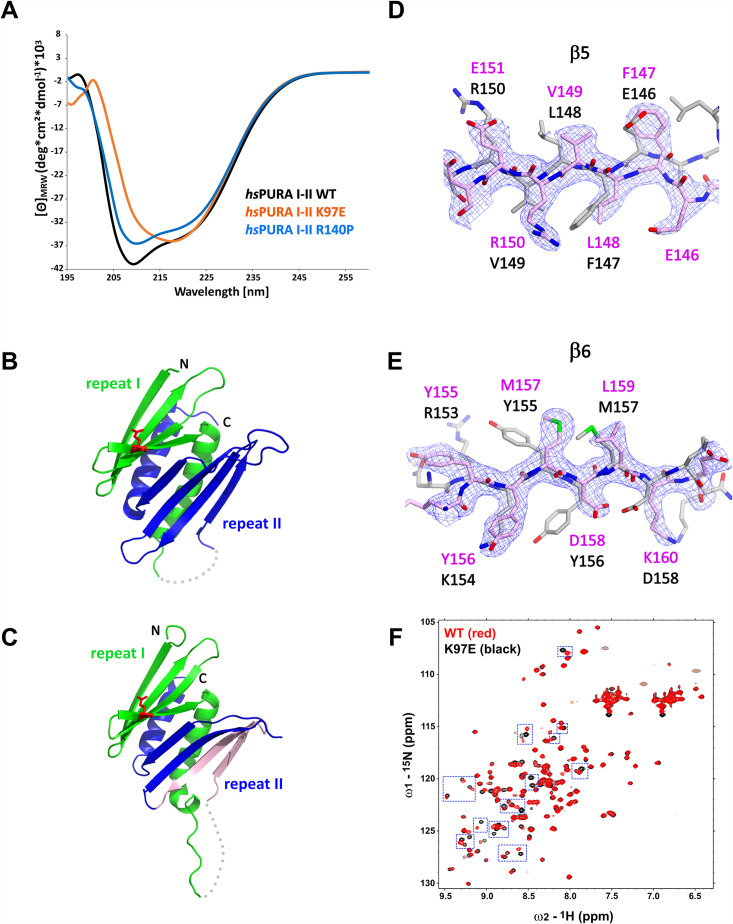
Figure 5. Structural analysis of hsPURA I–II bearing the K97E patient-derived variant.
(A) Circular dichroism (CD) spectroscopic analyses of hsPURA I–II, K97E, and R140P variants. Shown are the mean of three CD measurements for each of the proteins (n = 3). The spectra of hsPURA I–II K97E show a very different profile, indicating an altered fold of this variant compared to the wild-type form. (B, C) Crystal structures of hsPURA K97E repeats I (green) and II (blue) at 2.45 Å resolution, showing a high overall similarity to hsPURA (Figure 4A). Two independent hsPURA I–II K97E chains (A, B) in the asymmetric unit are shown in (B) and (C), respectively. The mutated amino acid K97E is indicated as red sticks. Positional shifts of amino acids in β5 (D) and β6 (E) strands of the chain B in the crystal structure of hsPURA I–II K97E. 2Fo–Fc electron density map (contour 1σ) is shown for the selected fragment of β5 and β6 strands in chain B (light pink). The superimposed chain A (gray) shows a register shift in chain B by +1 amino acid in the β5 strand and by +2 in the β6 strand. (F) Nuclear magnetic resonance (NMR) experiment with wild-type hsPURA I–II and hsPURA I–II K97E. Overlay of the 1H, 15N-HSQC spectra of hsPURA I–II (red) and K97E (black). Blue boxes indicate examples of changes between both spectra.


