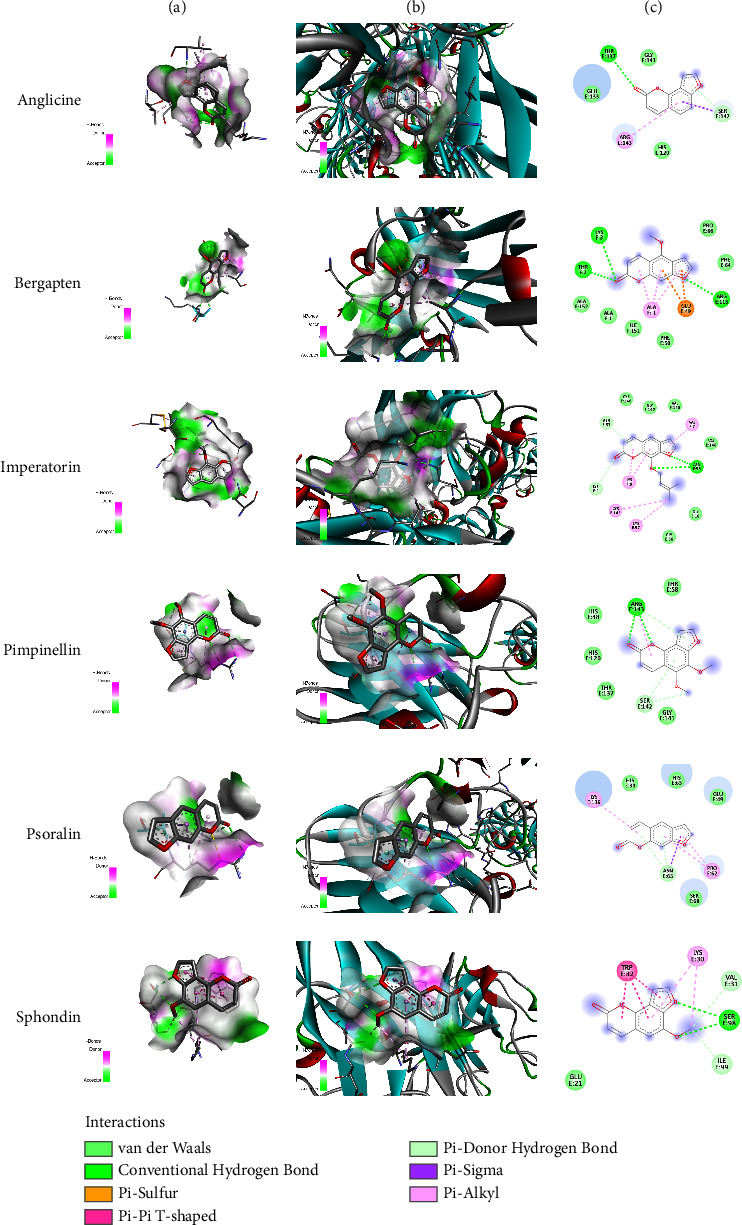
Figure 4.

In silico docking analysis of furocoumarins with SOD. Column (a) represents ligand interaction with SOD and column (b) represents 3D representation of ligands with protein while column (c) represents 2D representation of ligands with amino acids.
