Figure 11.
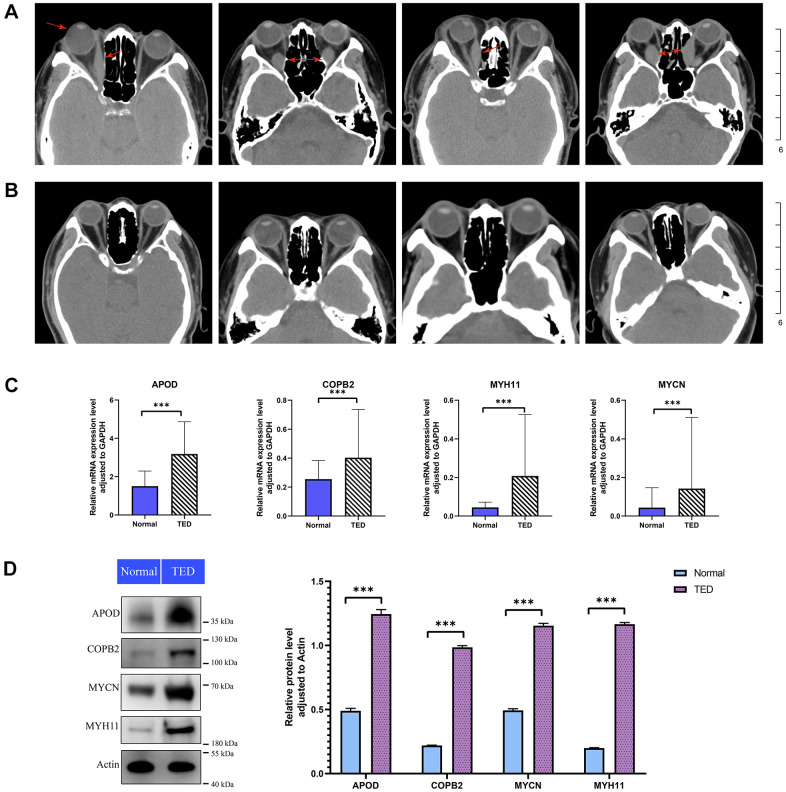
Imaging analysis and experimental validation. (A) CT images of patients with TED; red arrow: thickened rectus oculi and protruding bulbus oculi; (B) CT images of normal people; (C) qPCR for expression validation of the DEGs between TED and normal groups; (D) WB for expression validation of the DEGs between TED and normal groups. qPCR, quantitative polymerase chain reaction; WB, western blot. *P < 0.05, **P < 0.01, ***P < 0.001.

