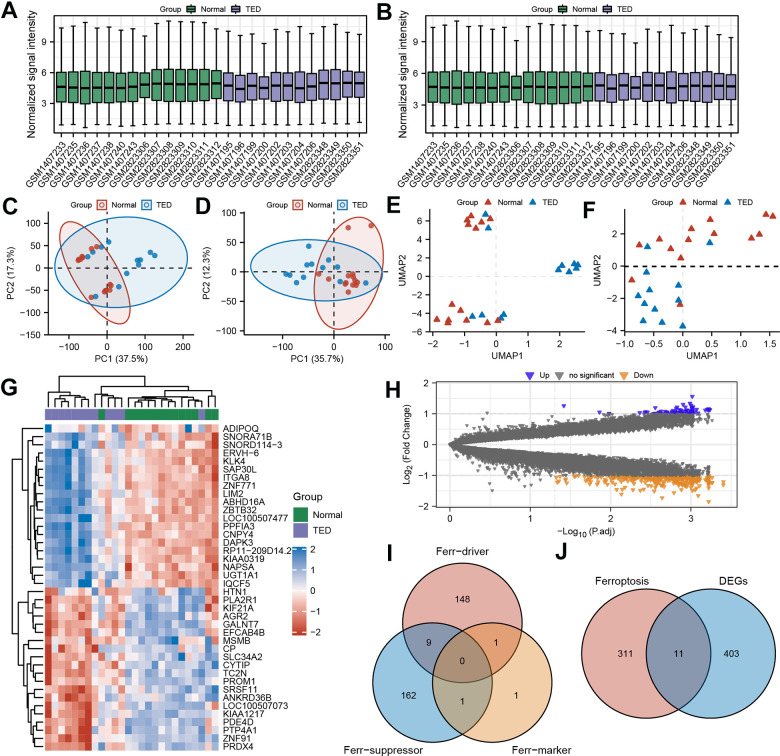
Figure 2.
Screening of ferroptosis-related DEGs (F-DEGs) in the lacrimal gland. (A, B) Box plot of gene expression before and after batch effect removal in the integrated GEO data; (C, D) PCA of gene expression before and after batch effect removal in the integrated GEO data; (E, F) UMAP of gene expression before and after batch effect removal in the integrated GEO data; (G) Heatmap of DEGs; (H) Volcano plots of DEGs; (I) Venn diagram of ferroptosis-related genes; (J) Venn diagram of the intersection of ferroptosis-related genes and DEGs. DEGs, differentially expressed genes; GEO, Gene Expression Omnibus; PCA, principal component analysis; UMPA, uniform manifold approximation and projection.

