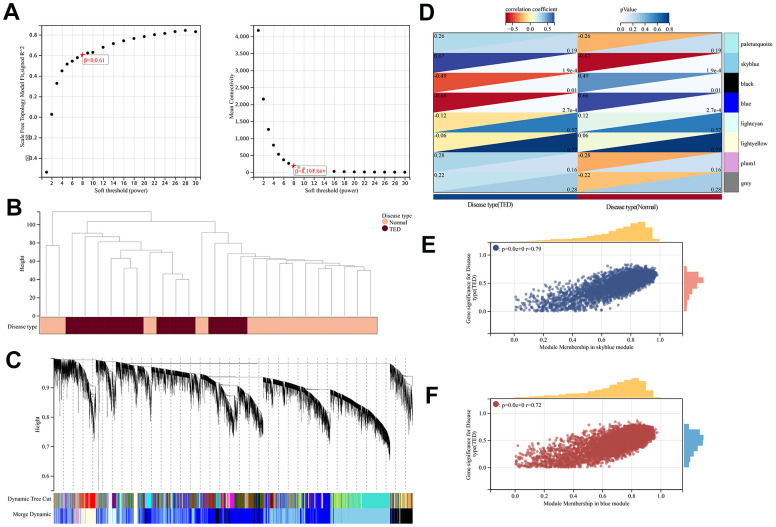
Figure 7.
WGCNA. (A) WGCNA of soft threshold screening; (B) Sample clustering and disease type; (C) Co-expression gene clustering; (D) Correlation analysis between co-expression gene modules and clinical characteristics; (E) Correlation analysis between MM and GS in the sky blue module; (F) Correlation analysis between MM and GS in the blue module. MM, module membership; GS, gene significance. *P < 0.05, **P < 0.01, ***P < 0.001.

