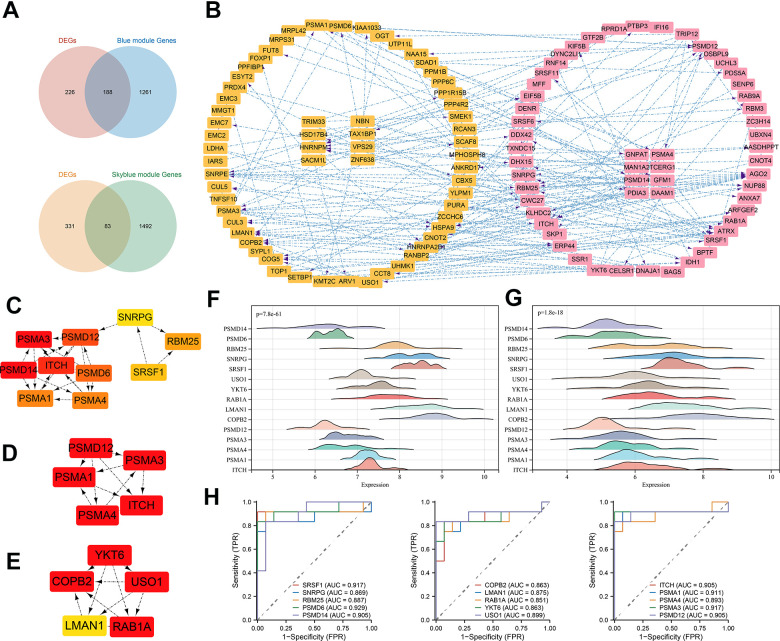
Figure 8.
PPI construction and hub gene identification. (A) Venn diagram of intersection of DEGs and most significant module genes; (B) PPI network of key genes in blue module; (C) Top 10 hub genes by MCC algorithm; (D) Top 5 hub genes of cluster 1; (E) Top 5 hub genes of cluster 2; (F) 15 hub genes expression distribution in normal samples; (G) 15 hub genes expression distribution in TED samples; (H) ROC curve of 15 hub genes. *P < 0.05, **P < 0.01, ***P < 0.001.

