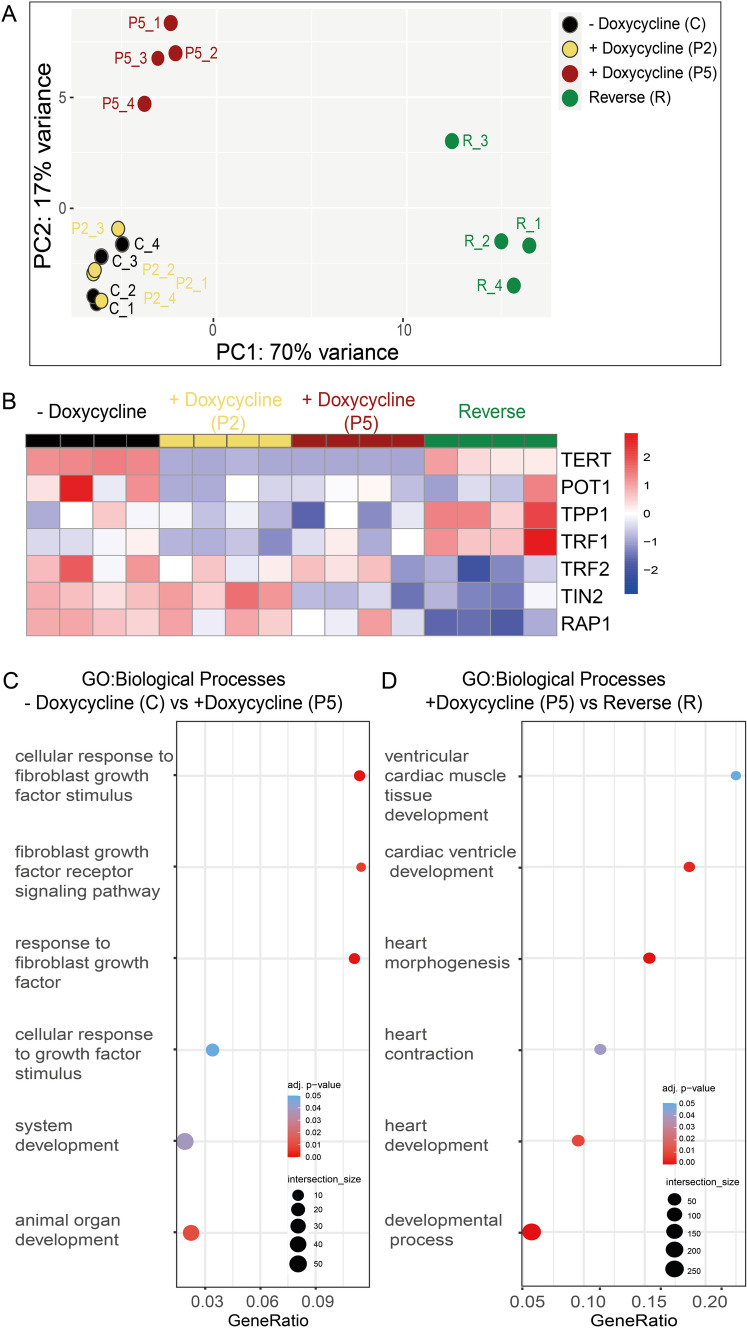
Fig. 3.
Global transcriptomic changes after telomerase modulation in CRISPRi TERT hiPSCs. A PCA plot indicates the distance between CRISPRi TERT hiPSC samples. X and Y axis show principal component 1 and principal component 2 that explain 70% and 17% of the total variance, respectively. (n = 4 per condition) CRISPRi TERT hiPSCs long (− Doxycycline, C, black circles), intermediate (+ Doxycycline, P2, yellow circles), short telomeres (+ Doxycycline, P5, red circles) and the reverse group (doxycycline removed for 2 weeks from P5 samples, R, green circles) (Supplemental Table 1 for list of top 2000 highly expressed genes) B Heatmap illustrates the differential gene expression of telomerase and telomere shelterin proteins between CRISPRi TERT hiPSCs under different conditions (x-axis: C, P2, P5 and R) (n = 4 /condition) in red: upregulation, in blue: downregulation C Bubble plots of functional enrichment analysis. The plot shows selected Gene Ontology Biological Processes enriched after treatment with doxycycline 5 passages. (Supplemental Table 2 for whole functional enrichment analysis). D Gene Ontology (GO) analysis of differentially regulated genes shows overrepresented biological process between R and P5 as depicted in bubble plots. Bubble size represents the ratio between the genes connected to a process and the overall query size. The color scale shows the adjusted p-value (Supplemental Table 3 for whole functional enrichment analysis)

